Note:
This topic has been translated from a Chinese forum by GPT and might contain errors.Original topic: 扩容CDC节点之后,grafana面板无法看到新节点
[TiDB Usage Environment] Production Environment
[TiDB Version] v5.1.1
[Reproduction Path]
Originally expanded and installed 4 ticdc instances normally, now using tiup to expand and install 4 more cdc instances.
[Encountered Problem: Symptoms and Impact]
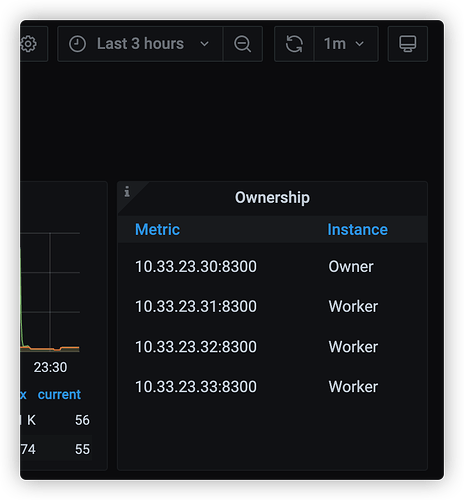
Installation was successful, tiup display shows up, and the changefeed can run normally (logs are being generated), but the new cdc instances do not appear on the Grafana dashboard.
How can I make them appear on the Grafana dashboard?
[Resource Configuration]
[Attachments: Screenshots/Logs/Monitoring]


