Note:
This topic has been translated from a Chinese forum by GPT and might contain errors.
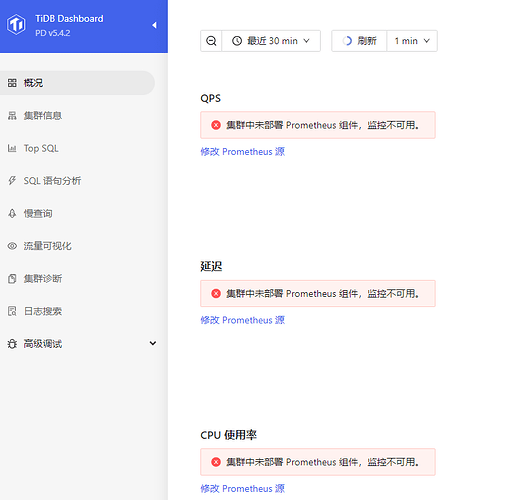
Original topic: pd dashboard报“集群中未部署 Prometheus 组件,监控不可用。”
[TiDB Usage Environment] Production Environment
[TiDB Version] v5.4.2
[Reproduction Path] Bare-metal deployment of TiDB, used for three years, current version running for six months, first time encountering this issue
[Encountered Problem: Symptoms and Impact] PD dashboard suddenly reports an error: Prometheus component not deployed in the cluster, monitoring unavailable.
Is there any other way besides manually modifying the Prometheus address? What is the cause of this issue, and what does the “failed to reload persist options” in the logs mean? There have been numerous warnings of this kind.
Error Screenshot
PD Logs
Cluster Status
Are there any errors reported in the Prometheus logs?
Have the monitoring components been restarted?
This morning, when I saw an anomaly in the PD dashboard, I thought it was an issue with Prometheus and restarted Prometheus once. However, the problem persisted.
I manually changed this, and it worked fine. The problem is that the cluster topology hasn’t been changed, so why did it suddenly become unrecognizable?
Another point is that Grafana monitoring is normal, and Grafana’s data source and PD use the same Prometheus.
You can try deploying it manually.
You can check the configuration file. Currently, the Prometheus component is not recognized in the PD panel cluster.
Deploy what? All monitoring services are in a normal state.
The configuration file is also normal, and the cluster topology is normal. At the beginning, PD could recognize Prometheus, but after six months, it suddenly couldn’t recognize the address.
Hello,
Can you try reloading the monitoring? tiup cluster reload -R prometheus,grafana,alertmanager
I just tried it, the problem still persists.


