Note:
This topic has been translated from a Chinese forum by GPT and might contain errors.
Original topic: 表格数量在 4000 万,大小为 10G ,执行 IN 条件查询,性能差
Last Friday around 11 AM, I noticed high latency in the cluster on the dashboard, with 99.9% latency at 6 seconds and 99% request latency at 3 seconds.
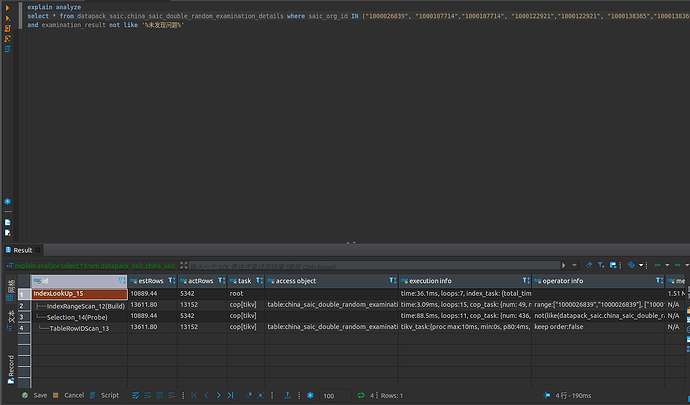
Upon checking the slow SQL, I found that the query on one of the tables was causing the issue. The SQL is very simple, just a regular IN condition query, and the explain analyze shows that it uses an index.
Detailed explain analyze information
explain.txt (144.9 KB)
The cluster has 3 TiKV, 3 TiDB, and 3 PD, deployed in a mixed manner using NUMA. TiKV is deployed on numa_node 0: 32 VCore 64G, and TiDB and PD are deployed together on numa_node 1: 32 VCore 64G.
Similar issues have occurred before. When there are a large number of IN condition queries on large tables (hundreds of millions of rows) with the number of IDs in the query ranging from 500 to 2000, the system latency tends to be high.
QPS, has the concurrency of this SQL increased? Check the resource cleanup when it’s slow. How is the speed when executing this SQL alone after the system returns to normal?
When executed individually, it is relatively fast and doesn’t take that long.
This statement has high concurrency at that point, the CPU is likely under heavy pressure, causing delays.
The latency of individual executions is normal now.
Last Friday during this time period, the cluster’s QPS was also relatively low, less than 1k, but there were quite a few IN condition queries, all similar SQLs.
During that period, the TiKV CPU was quite busy.
使用 PingCAP Clinic Diag 采集 SQL 查询计划信息 | PingCAP 文档中心 Install clinic to collect information on sudden latency spikes and the previous half-hour data.
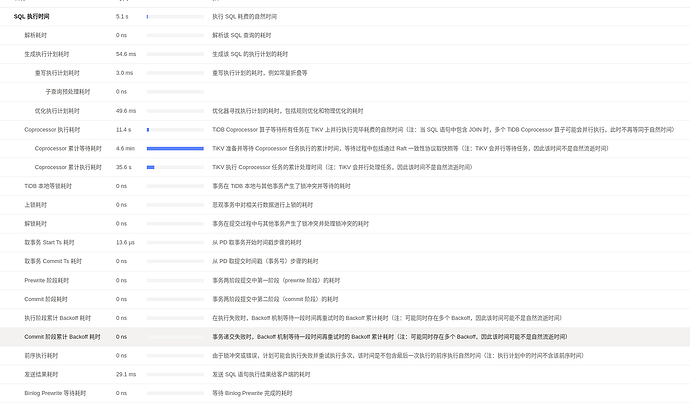
Check the TiDB Dashboard to see which part of the slow SQL is taking the most time, and then look at the corresponding module’s monitoring based on that point to locate the issue.
The diag here can only be updated to v.0.3.2, but the documentation requires an update to v0.7.3. Tiup is installed offline.
The TiDB cluster here is v5.3.0. Do I need to upgrade it to use the diag client?
Check the anomalies in tikv-details-coprocessor, but it’s still best to follow the previous suggestion to collect clinic information for easier troubleshooting.
Check the Thread CPU in tikv-details. Is it reaching a bottleneck?
You can first try if this version can collect: tiup diag collect <cluster-name> -f <start-time> -t <end-time>. If it doesn’t work, download a higher version of the TiDB offline package, then tiup mirror set /path-to-offline-package and then update diag (you may need to update tiup).
Okay, I’ll give it a try.
Here are two files, which contain information on Thread CPU and Coprocessor Detail for the respective time periods.
The unified thread pool has reached a bottleneck.
So, should this be done through parameter tuning or do we need to add more machines?
This is the CPU usage of the Unified Read Pool in the last 30 minutes. It is found to be very unbalanced, with one machine being very high and the other two machines being very low. This cluster uses HAProxy for load balancing.
I agree. Looking at the execution information of that slow SQL, it seems that most of the time is spent waiting in the queue. It should be queued here.

