Note:
This topic has been translated from a Chinese forum by GPT and might contain errors.Original topic: 替换监控节点不采集监控
[TiDB Usage Environment] Production Environment
[TiDB Version]: 5.2.2, 5.2.3
[Encountered Issue]: Replacing Monitoring Machine
<1> Take the existing monitoring nodes offline, including Prometheus, Grafana, and Alertmanager.
<2> Then scale out to the same physical machine with the following configuration:
monitoring_servers:
- host: 10.1.1.1
  port: 666
  deploy_dir: /work/tidb666/prometheus-777
  data_dir: /work/tidb666/prometheus-777/data
  log_dir: /work/tidb666/prometheus-777/log
  storage_retention: 5d

grafana_servers:
- host: 10.1.1.1
  port: 888
  deploy_dir: /work/tidb666/grafana-888

alertmanager_servers:
- host: 10.1.1.1
  web_port: 999
  cluster_port: 555
  deploy_dir: /work/tidb666/alertmanager-555
  data_dir: /work/tidb666/alertmanager-555/data
  log_dir: /work/tidb666/alertmanager-555/log
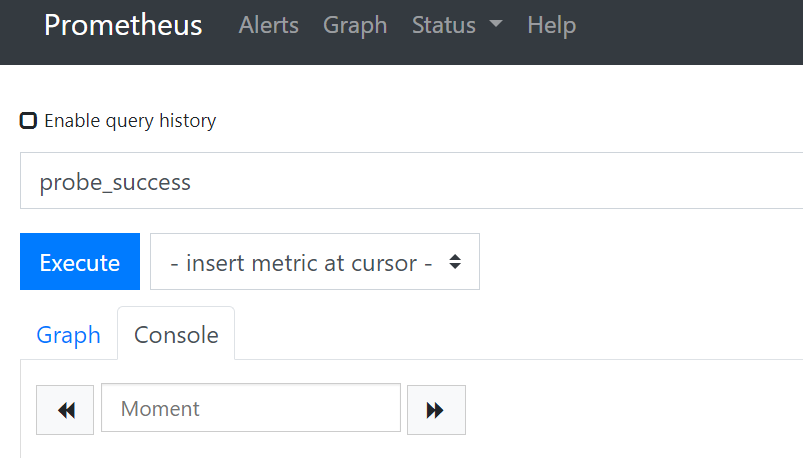
<3> After scaling out, it was found that the Prometheus monitoring item probe_success could not collect the three monitoring items of 10.1.1.1: node_exporter, black_export, and grafana.
<4> Enabling the debug log level of black_exporter revealed that it does not collect the IP 10.1.1.1.
