Note:
This topic has been translated from a Chinese forum by GPT and might contain errors.
Original topic: 另开新帖,探究pd集群挂掉的原因
[TiDB Usage Environment] Production Environment
[TiDB Version] v5.4.2
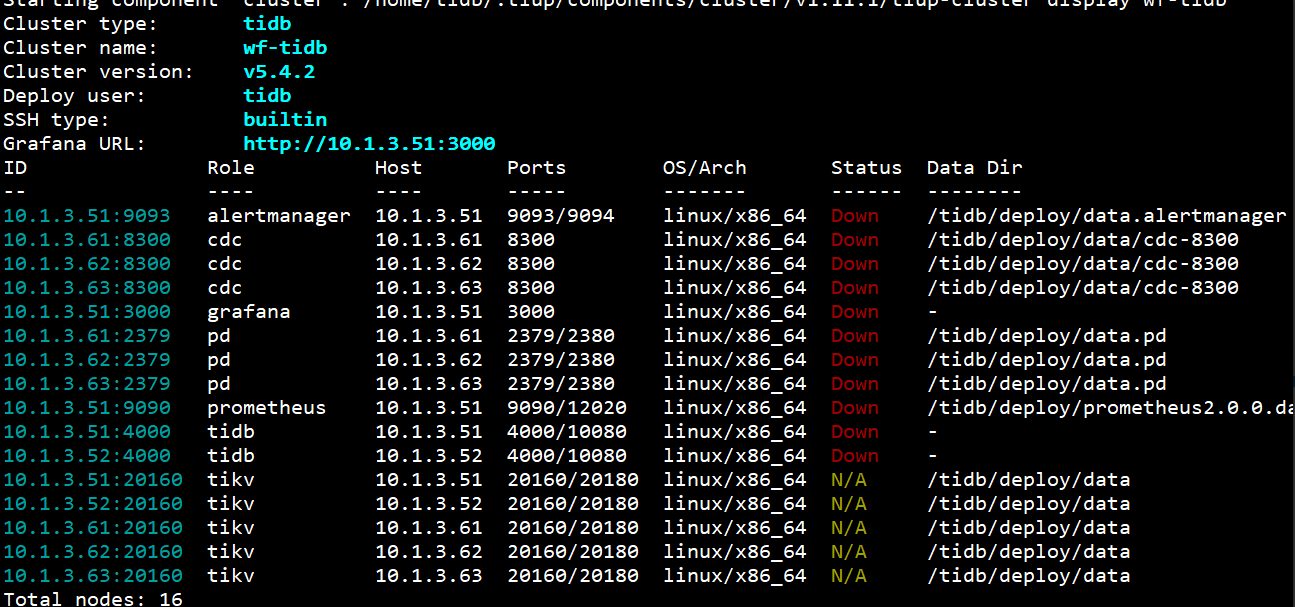
[Encountered Problem: Phenomenon and Impact] The entire PD cluster went down, and restarting did not resolve the issue. The cluster was restored to normal by resetting the PD cluster through pd-recover. However, the cause of this problem needs further investigation.
[Resource Configuration] 40 cores, 128G
pd_61.log (1.2 MB)
pd_62.log (51.9 MB)
pd_63.log (1.3 MB)
Could it be that this issue has been reintroduced in version 5.4.2?
Why put CDC and PD together to compete for resources? It’s obviously unreasonable…
The logs here show that the connections are lost. Are you sure the network is okay?
If resources are insufficient, it’s better to scale down a bit. 3 TiKV, 1 TiDB, and 3 PD should be enough… (make the best use of resources)
We don’t have that much traffic, and resources are sufficient.
The network is definitely OK!
Even if, hypothetically, the network fails at some point, the cluster should be able to start after the network recovers, right? But when I connect to the server and restart the service, it still fails. This is the point that needs attention, rather than looking for reasons in external factors like insufficient resources or network issues.
Are you sure there is enough disk space?
The PD restarted N times in a short period, and each time it panicked…
It’s more common for TiDB to panic, but not for PD. [The brain is down… 

 ] It’s best to check the environment (what do you mean by external? If resources are insufficient, how can the software run?)
Moreover, the environment is visible to you. What I can see is only the information you provide, and all of it is just speculation.
With insufficient information, we can only judge based on experience… I hope you understand.
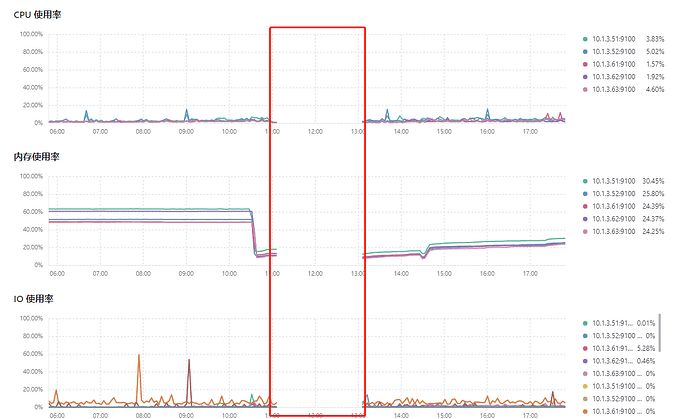
Brother, I’ve posted a screenshot. Please check where the resource is insufficient. Our hard drive is currently only using 21% of the space, so it should be enough.
The specific situation is:
First, this problem suddenly appeared, and then after a while, the PD went down.
I don’t think the PD dashboard would fail to get the cluster configuration for no reason, right?
The monitoring graph you posted shows a complete interruption in the middle, which is obviously abnormal… Did the entire cluster’s instances all go down? 
Well, the interruption here is caused by the PD going down, which in turn leads to the entire cluster going down.
It is suspected that resource contention is causing this issue. Monitoring can only capture continuous records, and short-term peaks cannot be obtained.
I suggest you scale down CDC and continue to observe.
I don’t think it’s a resource issue. We really don’t have that much traffic, and the data isn’t much, only 1.6T. It’s impossible to remove CDC, not in this lifetime 
Previously, PD did crash because of CDC: pd三个节点同时挂掉,大量报错:invalid timestamp - TiDB 的问答社区
But it wasn’t due to resources; it was because CDC requested PD too frequently.
Our servers should definitely be able to handle this amount of data.
Are you saying you can’t get which Prometheus? I can’t reproduce this phenomenon anymore.


