The number of Leaders on a TIKV node on a certain machine suddenly dropped to 0

Note:
This topic has been translated from a Chinese forum by GPT and might contain errors.

Original topic: 某台机器上 TIKV 节点 突然Leader数量跌为0

| username: Harvey

[TiDB Usage Environment] Production Environment
[TiDB Version] 4.0.12
[Reproduction Path] Deleting data from a table with 10 indexes
[Encountered Problem: Phenomenon and Impact]
Environment: The TiDB cluster has 6 KV nodes distributed across 3 machines, with two KV processes on each machine.
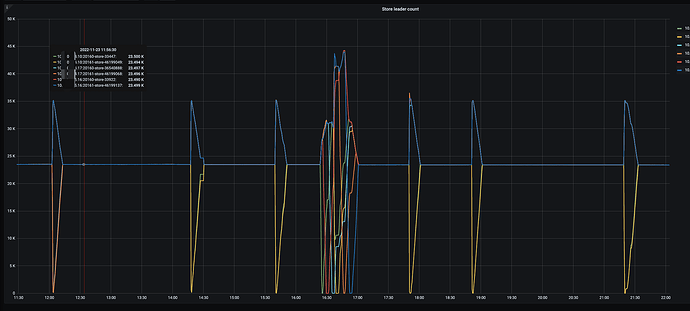
Problem: The three KV machines are xxx.xxx.xxx.10, xxx.xxx.xxx.16, and xxx.xxx.xxx.17. Among them, xxx.xxx.xxx.17 and xxx.xxx.xxx.10 frequently experience the Leader count dropping to 0, and then immediately start balancing the leader, returning to a balanced state. The drop to 0 occurs simultaneously for the two instances on the machine.

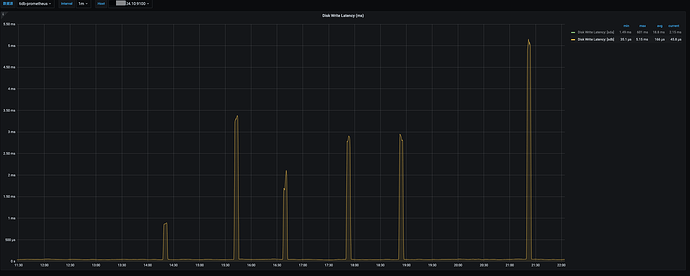
When the Leader count drops to 0 and then balances, there is a period where the data disk IO utilization is very high, then it returns to normal.

When not deleting data, the Leader count does not drop to 0.

Checking the TiKV logs of the problematic Leader drop to 0, there are many occurrences of:
[2022/11/23 21:20:04.988 +08:00] [WARN] [store.rs:645] [“[store 33447] handle 971 pending peers include 917 ready, 1558 entries, 6144 messages and 0 snapshots”] [takes=39049]

Suspected machine issues, but no disk errors were found on the hardware, and the two machines alternately experiencing the issue is quite strange.

Monitoring information: https://clinic.pingcap.com.cn/portal/#/orgs/430/clusters/6932065597686668710?from=1669196400&to=1669203000

[Resource Configuration]
[Attachments: Screenshots/Logs/Monitoring]

In the above screenshot, the middle graph shows alternating changes in quantity, which can be ignored as it is during the reload of the TiKV node. Observe the three instances of Leader drop to 0 on the left and right.
| username: xfworld | Original post link

  1. Can the disk performance support two KV instances?

  2. Is the network being fully utilized? (Causing heartbeats to not be effectively transmitted)

| username: Harvey | Original post link

Hello,

  1. When the leader doesn’t drop to 0, the IO usage is at 60%, which is not high.
  2. The network card is a 10 Gigabit Bond, and I see the network traffic is only 39MB, far from reaching the bottleneck.
| username: dba-kit | Original post link

You can check if the store’s score is 100. It seems that when a slow node reaches 100, all the leaders on it will be evicted.

| username: dba-kit | Original post link

It feels like the scenario described here is quite similar to what you mentioned.

| username: dba-kit | Original post link

However, based on the description, it should only trigger the leader eviction when there is a single slow node. In your case, two nodes were evicted simultaneously, which theoretically shouldn’t cause the leader to be evicted.


Uh, ignore it. I didn’t notice your version is 4.X…

| username: Harvey | Original post link

Well, thank you. If it’s the scheduler, it should be gradually evicted. The performance suddenly drops to 0, which is very similar to a machine failure, but there are no related anomalies at the machine level, which is strange.

| username: Raymond | Original post link

Has there been any instance of TiKV restarting?

| username: Harvey | Original post link

There was no issue; it has been running normally.

| username: Harvey | Original post link

Did you find anything?

| username: Harvey | Original post link

clinic address: Clinic Service

| username: Jiawei | Original post link

This issue is caused by GC. During GC, resolving locks can put too much pressure on certain nodes, causing them to become unresponsive. As a result, PD will immediately evict the leader, and once the node recovers, PD will rebalance the leader again, leading to such scenarios.

image

You can check if the time when your leader drops matches the resolved locks in the TiKV details monitoring under GC. I guess they should be consistent. Then you can see if the IO at that time, such as GC scan_lock, causes the IO to be fully utilized.

| username: Billmay表妹 | Original post link

You need to authorize the friends who are helping to solve the problem so that they can see it.

| username: Harvey | Original post link

Hmm, it looks like the deletion speed is too fast, causing high GC pressure, and the GC threads are constantly at 100%.

| username: system | Original post link

This topic was automatically closed 60 days after the last reply. New replies are no longer allowed.