Note:
This topic has been translated from a Chinese forum by GPT and might contain errors.
Original topic: TiCDC CPU负载高
[TiDB Usage Environment] Production Environment
[TiDB Version] V6.1
[Reproduction Path] Operations performed that led to the issue
[Encountered Issue: Symptoms and Impact]
One of the three TiDB servers has a TiCDC node deployed, monitoring changes in some databases. After running the monitoring for a while, it was observed that the CPU usage of the TiCDC node reached 100%. Checking the processes revealed that the TiCDC process was consuming the CPU. We then paused the TiCDC task, killed the TiCDC process, and restarted the task, which temporarily resolved the issue. However, after a while, the CPU usage again reached 100%, even though there was no significant increase in incremental data at that time.
[Resource Configuration]
3 TiDB/PD nodes with 16 cores and 64GB RAM each, with one TiCDC node deployed on the first node
3 TiKV nodes with 16 cores and 64GB RAM each
[Attachments: Screenshots/Logs/Monitoring]
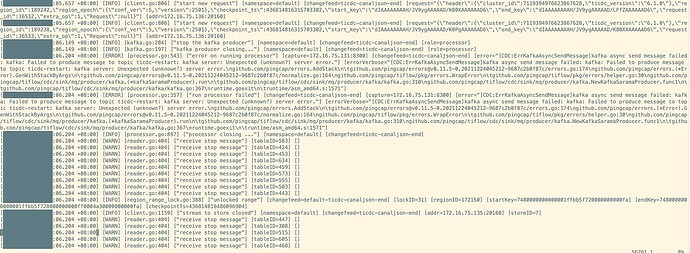
Here is the log when the exception first occurred:
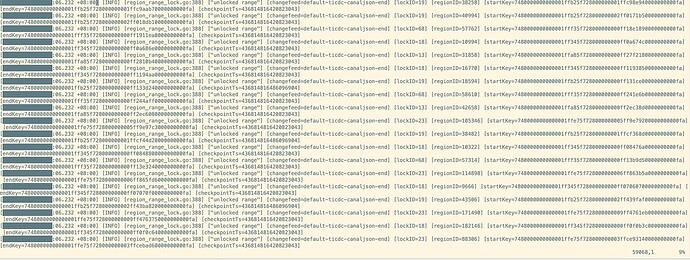
Here is the log after the CPU reached 100%:
It looks like there was an issue with the Kafka server at that time, but it shouldn’t have caused such a severe problem afterward, right?
Also, how do you view function calls with perf? Thanks for your guidance.
Can you help capture the profile when this issue occurs?
curl -X GET http://${host:port}/debug/pprof/profile?second=120s > cdc.profile # Capture CPU sampling for 120s

curl -X GET http://${host:port}/debug/pprof/goroutine?debug=2 > cdc.goroutine # Capture goroutine

curl -X GET http://${host:port}/debug/pprof/heap > cdc.heap # Capture heap
It is currently suspected to be caused by this bug. You can try using v6.1.2 cdc.
Okay, next time the CPU usage goes up, we’ll capture it. Thanks, thanks.
Sure, our task is to start CDC with version 6.2.0. Will switching to version 6.1.2 and restarting the service affect the previous tasks?
Sorry, I misspoke. 6.2.0 cannot be replaced with 6.1.2. Please use v6.3.0.
We are not sure about the CDC 6.3.0 version of our cluster. After downgrading CDC to 6.1.2, the issue has not reoccurred for 7 days. It seems to be resolved, but we will continue to monitor it. Thank you.
This topic was automatically closed 60 days after the last reply. New replies are no longer allowed.


