TIDB 4.0.5 Inner Join Query Slow

Note:
This topic has been translated from a Chinese forum by GPT and might contain errors.

Original topic: TIDB 4.0.5 inner join查询慢

| username: anryHan

[TiDB Usage Environment] Production Environment
[TiDB Version] V4.05
[Reproduction Path]
[Encountered Problem: Problem Phenomenon and Impact]
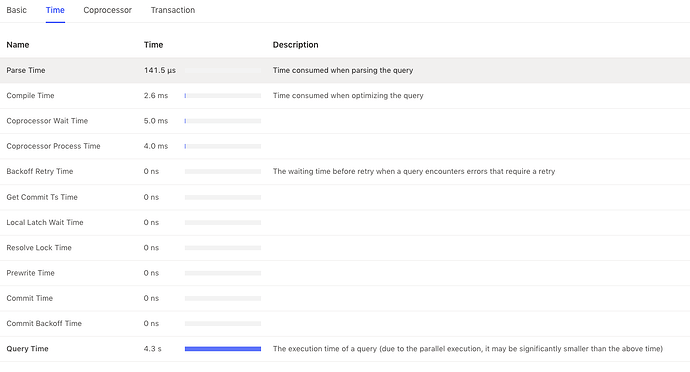
We executed a simple SQL query with an inner join between two tables. The execution plan for the slow SQL in the dashboard is shown below. The operator IndexLookUp_48 took 4.2 seconds to execute, but the execution times of the sub-operators below it are very short. How can we determine where the execution time for IndexLookUp_48 is being spent?


[Resource Configuration]
Cluster Information: pd: 3 nodes, tidb: 3 nodes, tikv: 5 nodes
image
tidb_index_join_batch_size (default value: 25000)
tidb_index_lookup_join_concurrency (default value: 4)

| username: h5n1 | Original post link

How is the CPU utilization during execution? Is the CPU in Performance mode?

| username: xfworld | Original post link

  1. Is there an actual difference in data volume between estrows and actrows? And are the values accurate?
  2. To determine query time, you first need to assess how much data needs to be traversed. The smaller the data volume to be traversed, the more accurate and faster it will be.
  3. The number of loops, that is, the number of iterations.

This can be used as a reference for judging the time consumption.

| username: anryHan | Original post link

The difference between estrows and actrows is caused by the greater than (>) and or conditions in the SQL. The loop in the diagram only runs three times.

| username: anryHan | Original post link

CPU utilization is low, it’s not in Performance mode.

| username: xfworld | Original post link

Didn’t you follow the official documentation deployment guide?