Note:
This topic has been translated from a Chinese forum by GPT and might contain errors.
Original topic: tidb 节点报错
[TiDB Usage Environment] Production Environment / Testing / Poc
[TiDB Version] v6.1
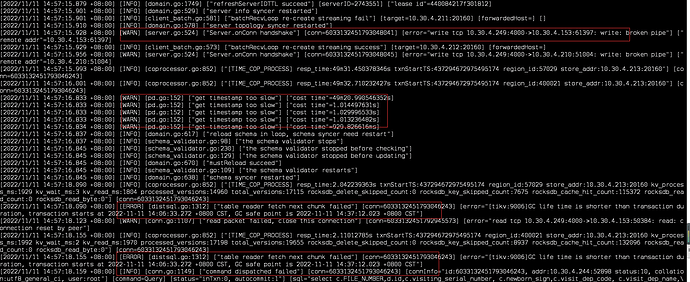
After a large number of data insertions on the TiDB node, the data prompts the following information, causing the program to be unable to connect to the node directly.
Uh… the kernel reported an error directly~ Is it because the resources are exhausted?
This is running statistical metrics in batches. There are no programs running on the TiDB machine; only one TiDB node is deployed on this machine.
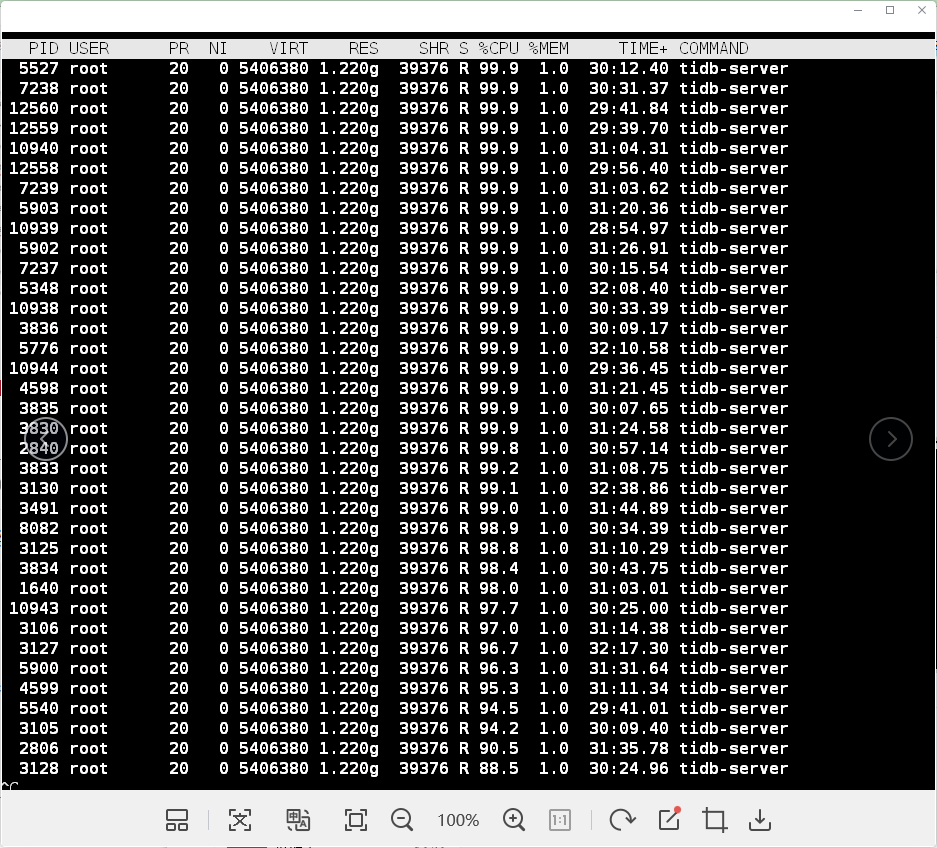
Take a look at the resource usage.
Is it through TiDB monitoring?
It’s already so high, how do we handle these?
This is calculated based on the number of cores. 1 core has a maximum of 100%, and 2 cores have a maximum of 200%.
First, I saw it go up to over 6000, and then the program connection was lost. Why is so much CPU being used, and it takes a long time to come down? Is there any optimization strategy for this?
Batch processing calculation Please provide slow SQL, usually in the dashboard.
Or first limit the timeout to 60 seconds and report an error if it exceeds that. Block the slowest SQL queries first.
This is the most time-consuming part here.
Each process is at 100%. How should this be handled? Or should the number of threads be reduced?
Logs
This error occurs when CPU, memory, and other resources are exhausted.


