Note:
This topic has been translated from a Chinese forum by GPT and might contain errors.
Original topic: TiDB 慢查询: Coprocessor 耗时长
[TiDB Usage Environment]
Production Environment
[TiDB Version]
TiDB v6.1.1
[Resource Configuration]
[Encountered Issues: Problem Phenomenon and Impact]
-
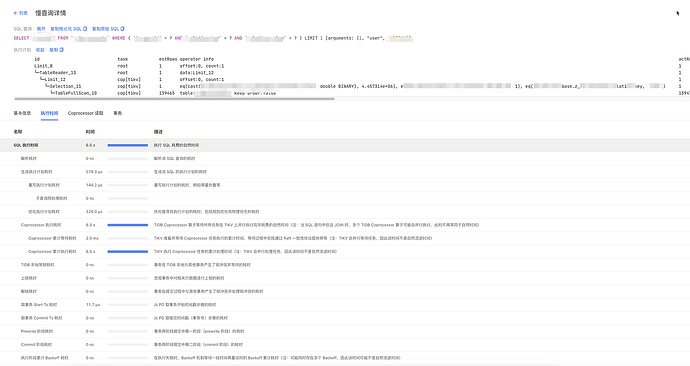
Relatively simple SQL queries (with indexes, total table data volume 150k) have very unstable query speeds. Slow queries >5s are common. Normally, this query takes <0.2s.
-
During the times when slow queries occur, TiDB Dashboard monitoring does not show any peaks in CPU, memory, or QPS.
-
For the slow queries, the Coprocessor execution time takes up the majority.
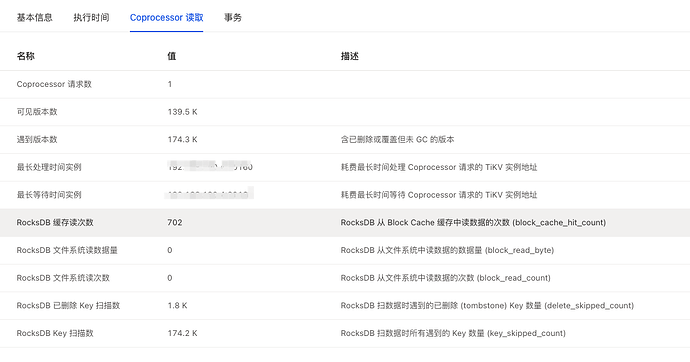
Visible version 139k, this SQL has already scanned 140k data…
You can check the SQL Statement in the Dashboard to see if this SQL has two execution plans. Additionally, as WalterWj mentioned, due to the high number of data versions, you need to confirm whether this table has a large amount of data update logic, what the gc-life-time is, and whether the GC tasks are normal (check if the savepoint is normal through the TiKV-details → GC panel).
Is it possible that the execution plan has changed? Scanning the entire table with 139,000 rows to select one row. Check if the duration corresponds to any fluctuations in the slow query time points.
Could you post the table structure and the executed SQL statements?
Is it because the DML operations on this table are too frequent? I have encountered a situation where count is very slow when there are high concurrent inserts and updates on a table, but it returns instantly when the application is stopped.
It could be that the GC time is too long, 48 hours.
Does a long GC time also affect this count(*)? Isn’t the read operation supposed to read the most recent version?


