Note:
This topic has been translated from a Chinese forum by GPT and might contain errors.
Original topic: tidb sql执行计划
[TiDB Usage Environment] Production Environment / Test / Poc
Production Environment
[TiDB Version]
5.2.1
[Reproduction Path] What operations were performed when the problem occurred
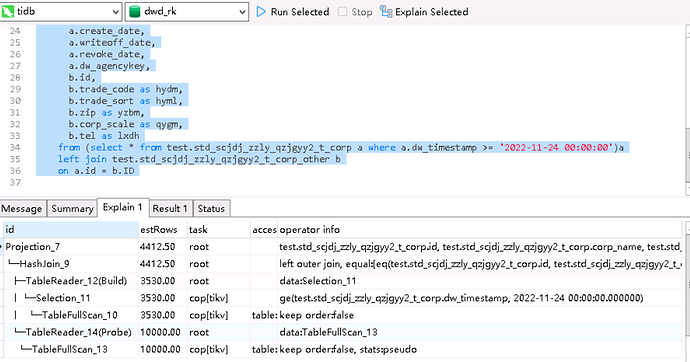
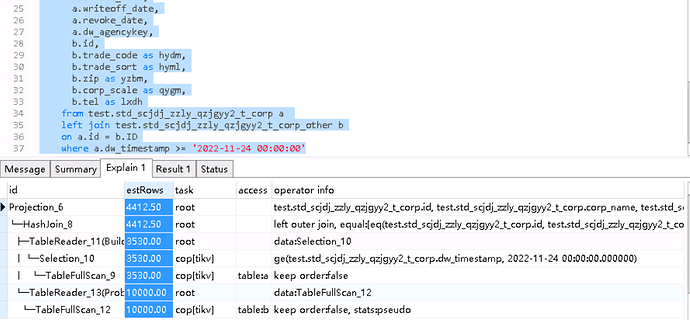
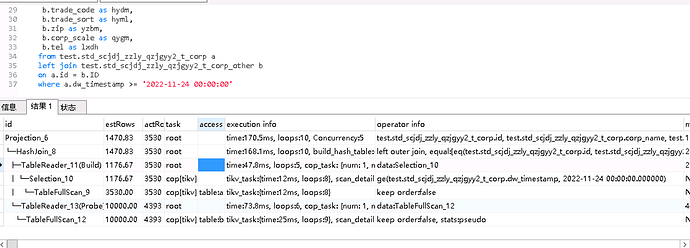
Is the SQL execution plan of TiDB different from MySQL? I wrote two different queries and found that the execution plans were the same, but the query speeds were different. I want to ask why.
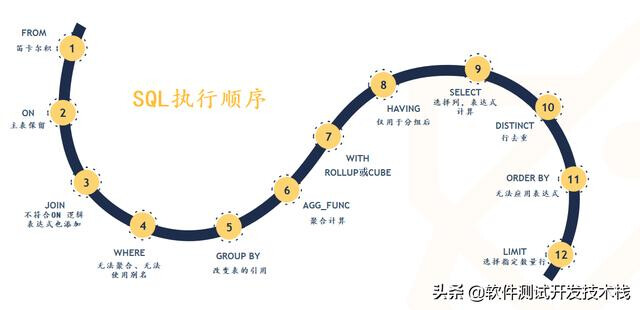
This is the execution plan order of MySQL

[Encountered Problem: Problem Phenomenon and Impact]
[Resource Configuration]
[Attachments: Screenshots/Logs/Monitoring]
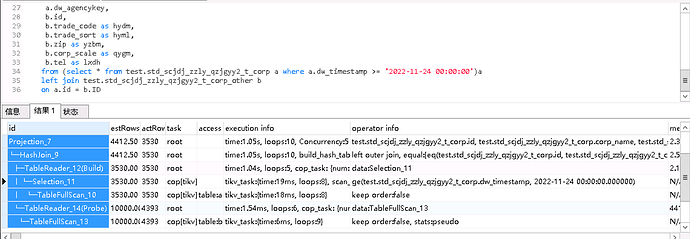
Please post the full execution plan of the explain analyze.
 The screenshot is complete, that’s all there is.
stats:pseudo The statistical information may be inaccurate. Use the method mentioned in the first post: explain analyze to output the execution plan.
explain analyze is not explain.
Could you put it in a text document? I want to see the specific differences in execution/operator info.
I guess whether the TiDB optimizer has made optimizations for the second method, first adding the where condition to reduce the number of rows in the left join table, thereby reducing the cost of the left join.
1.xls (11 KB)
2.xls (11.5 KB)
If you see stats:pseudo, you can directly perform analyze on the table.
Looking at the two plans, there is a difference in RPC time. Is the first slow SQL always executed first and then the second one? Is the first slow SQL still slow when executed the second time? Do you have other TiDB environments? Try importing the data of the two tables into other environments and see the execution results.
With caching, queries are fast. It is possible that, as mentioned above, TiDB internally first adds the WHERE condition to reduce the number of rows in the left table of the LEFT JOIN, thereby reducing the cost of the LEFT JOIN.
The number of actrows for the same operator in the two execution plans and the number of scanned keys are the same.
+1, it has little to do with join, the main issue lies in rpc_time;
- rpc_time represents “the total time of sending Cop type RPC requests to TiKV,” recorded by merging runtime information in tikv-client go;
- rpc_num represents “the number of the same RPC requests”;
- rocksdb: {delete_skip_count …} : originates from protobuf, sent from TiKV → see definition
- tikv_task: {time …} is also sent from TiKV, → see definition
- This issue has only 1 rpc_num, indicating that the same request has varying execution times when performing tasks in TiKV;
Generally, there are two possible reasons for this issue:
- Time is consumed by network jitter.
- It is a long-tail situation where most requests are at the ms level, occasionally jumping to the s level. The proportion of s-level requests is not high and cannot be seen without changing the monitoring (p99, p999). However, from the related rocksdb information corresponding point of TiKV feedback, it is unlikely to be slow in the TiKV processing flow. In other words, the slowness occurs in grpc request end + network + grpc response end. It could be that rust grpc is slow (low probability), TiKV grpc goroutine is slow (low probability), or the network is jittery.
It seems that this situation should account for a small proportion of the total execution times of this SQL, right?
- For network jitter, check ping latency.
- If you want to investigate the execution of grpc request end and grpc response end in detail, you can look at the grpc panel under tikv-details in the TiKV test. You may need to modify the quantile curve to see extreme cases by changing the 99 line to 1.
- If it can be reproduced stably, it is best to trace it. At the same time, observe which TiKV the request for this region is sent to, and then follow the request chain panel to see if there are any clues.
For example: In a static environment with only one request, the time obtained by subtracting TiKV Details → Grpc → grpc message duration from TiDB → KV request → KV request duration should correspond to rpc_time, but the production environment is relatively loaded.
You can first check the above information.
This topic was automatically closed 60 days after the last reply. New replies are no longer allowed.
