Note:
This topic has been translated from a Chinese forum by GPT and might contain errors.Original topic: tikv 在同等的流量下,使用 batch读写, IO utilization 会升高 50% 以上
[TiDB Usage Environment] Production Environment
[TiDB Version] v6.1
[Reproduction Path] Operations performed that led to the issue
[Encountered Issue: Issue Phenomenon and Impact]
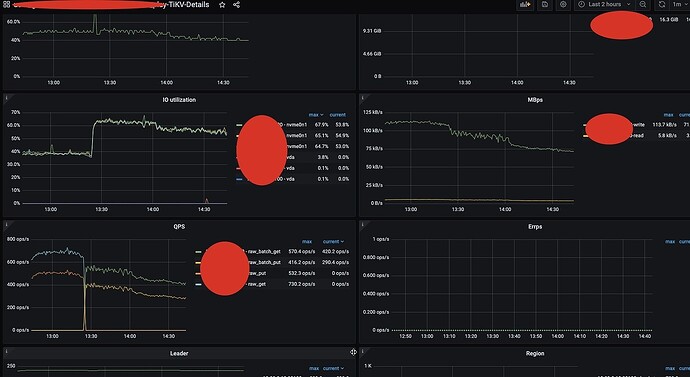
At 13:23 in the image, I changed raw_put to raw_batch_put and raw_get to raw_batch_get, with a batch size of 60. After making these changes, I noticed that the machine’s IO utilization increased by 80%.
You can see that the traffic before and after the change did not vary much, and even decreased.
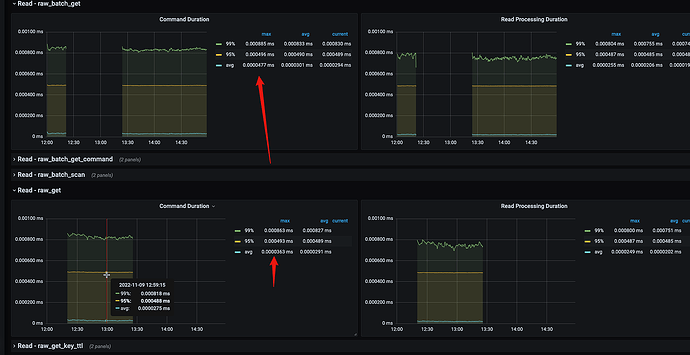
Moreover, the metrics for raw_batch_get and raw_batch_put only slightly decreased, but according to my service-side statistics, it is indeed 1/60.
[Resource Configuration]
server_configs:
  tidb:
    log.slow-threshold: 300
  tikv:
    readpool.coprocessor.use-unified-pool: true
    readpool.storage.use-unified-pool: false
  pd:
    replication.enable-placement-rules: true
    replication.location-labels:
    - host
  tidb_dashboard: {}
  tiflash:
    logger.level: info
  tiflash-learner: {}
  pump: {}
  drainer: {}
  cdc: {}
  kvcdc: {}
  grafana: {}
[Attachments: Screenshots/Logs/Monitoring]


