Note:
This topic has been translated from a Chinese forum by GPT and might contain errors.
Original topic: 1.5亿大表Healthy为0,统计信息收集没成功过?
[TiDB Version] V6.1 (upgraded from V5.4)
[Problem Description] A table with approximately 150 million rows has a Healthy value of 0.
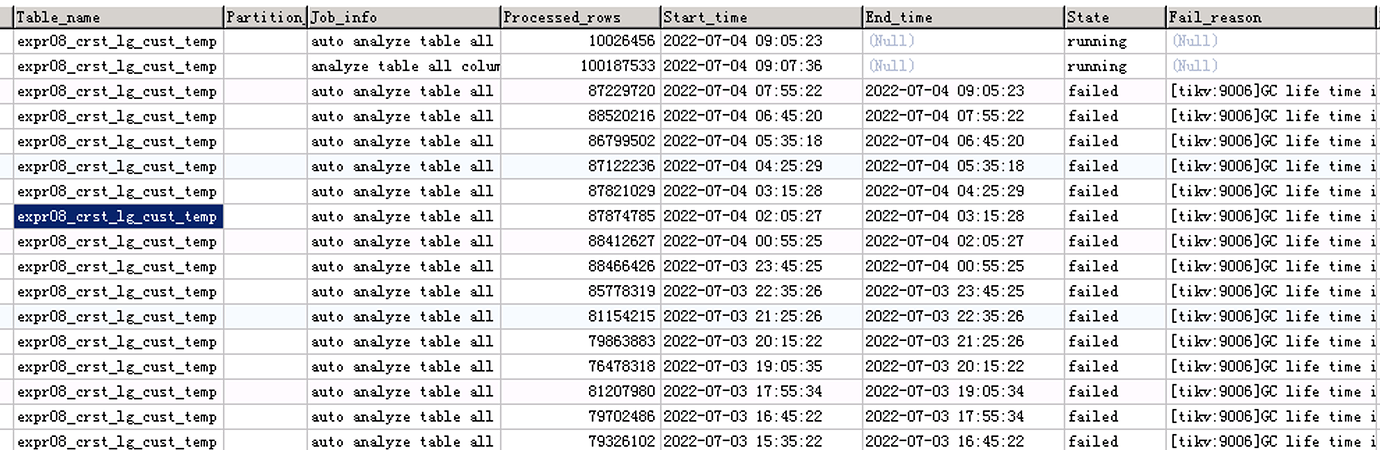
show analyze status; mostly shows failed collection information for this table, and it is continuously collecting.
The tidb_gc_life_time parameter has been adjusted from the default 10m to 60m, but it still fails to collect. This parameter cannot be adjusted indefinitely. What if there are several such large tables in production?
    MySQL [XX]> select count(0) from expr08_crst_lg_cust_temp;
    +-----------+
    | count(0)  |
    +-----------+
    | 146690000 |
    +-----------+
    1 row in set (6.29 sec)

    MySQL [XX]> show stats_healthy where table_name='expr08_crst_lg_cust_temp';
    +---------+--------------------------+----------------+---------+
    | Db_name | Table_name               | Partition_name | Healthy |
    +---------+--------------------------+----------------+---------+
    | XXX     | expr08_crst_lg_cust_temp |                |       0 |
    +---------+--------------------------+----------------+---------+
    1 row in set (0.01 sec)
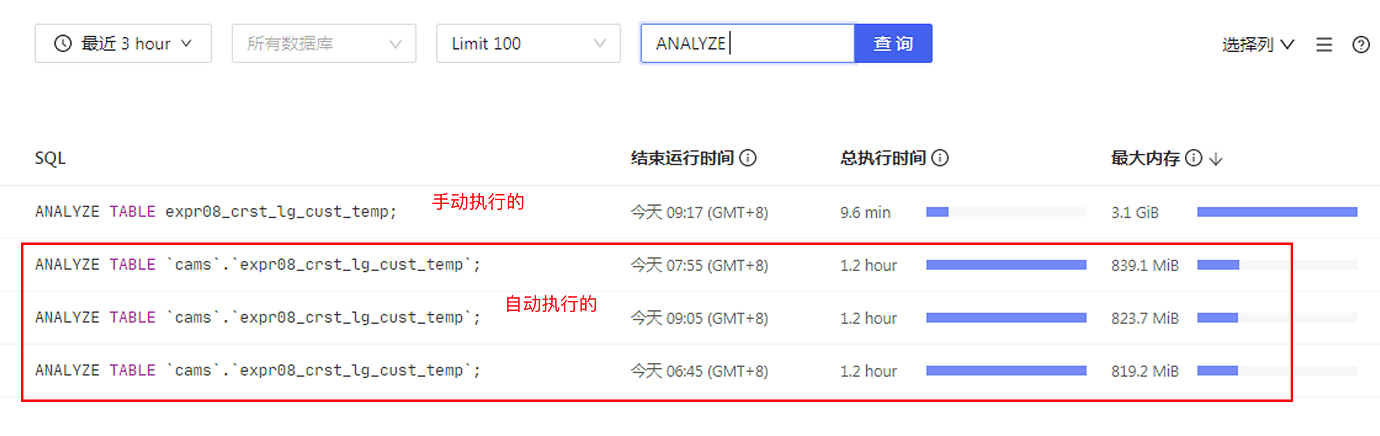
Now trying to run it manually.
Manual collection, it took less than 10 minutes to run.
What is the difference between manual collection and automatic collection? Why is manual so fast?
Slow log screenshot:
Your memory usage of 800MB can easily exceed 1GB and get terminated.
That parameter has already been changed. Exceeding write to disk.
The main reason is that TiDB automatically collects statistics. The following statistics parameters are all set to 1. It is recommended to manually set scheduled tasks to collect statistics for large tables.
Check the current values:
mysql> show variables like 'tidb_build_stats_concurrency';
+------------------------------+-------+
| Variable_name                | Value |
+------------------------------+-------+
| tidb_build_stats_concurrency | 4     |
+------------------------------+-------+
1 row in set (0.00 sec)

mysql> show variables like 'tidb_distsql_scan_concurrency';
+-------------------------------+-------+
| Variable_name                 | Value |
+-------------------------------+-------+
| tidb_distsql_scan_concurrency | 15    |
+-------------------------------+-------+
1 row in set (0.00 sec)

mysql> show variables like 'tidb_index_serial_scan_concurrency';
+------------------------------------+-------+
| Variable_name                      | Value |
+------------------------------------+-------+
| tidb_index_serial_scan_concurrency | 1     |
+------------------------------------+-------+
1 row in set (0.01 sec)
This topic was automatically closed 1 minute after the last reply. No new replies are allowed.