Note:
This topic has been translated from a Chinese forum by GPT and might contain errors.Original topic: 一个tikv节点down掉后,无法重启
[TiDB Usage Environment] Production Environment
[TiDB Version] v5.4.0
[Reproduction Path]
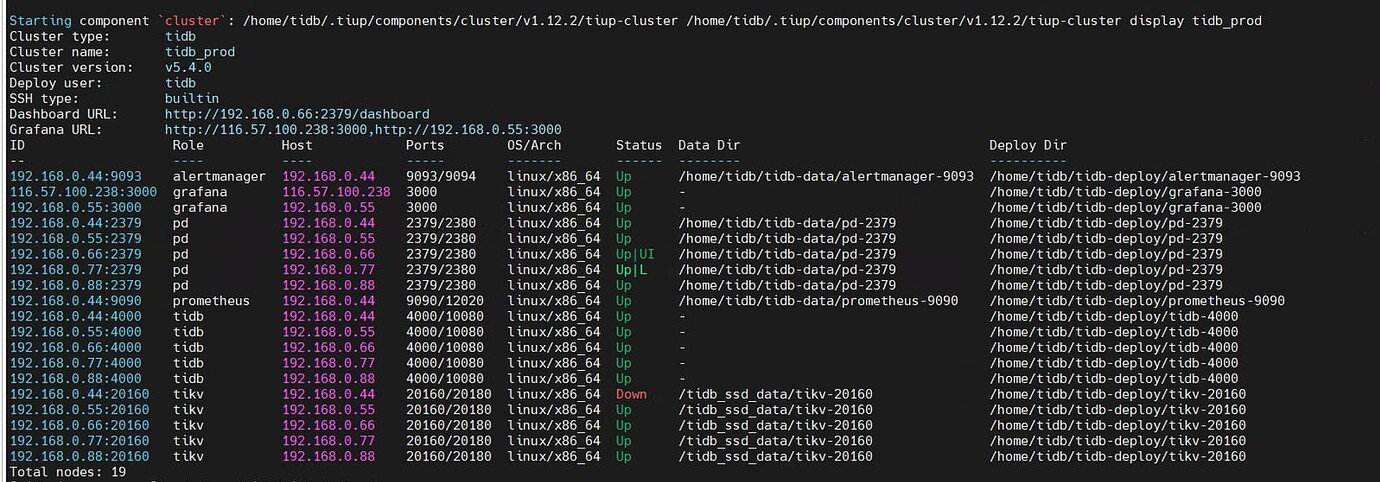
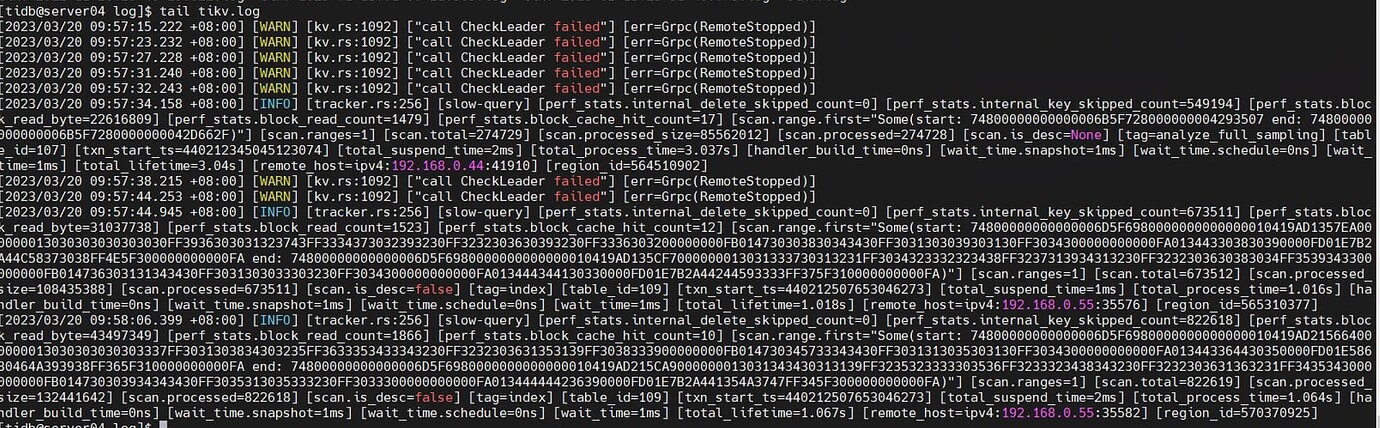
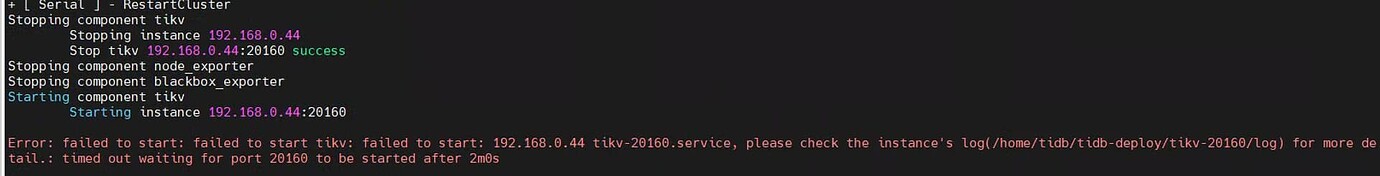
[Encountered Problem: Problem Phenomenon and Impact] One TiKV node went down a long time ago and cannot be restarted. It was not handled in time, but TiDB is still usable.
[Resource Configuration]
[Attachments: Screenshots/Logs/Monitoring]
------------ Divider ----------------------------------------------------------------------------------------------------
On July 20th, after performing a scale-down operation, the TiKV node has been in a pending offline state and has not turned into Tombstone. Running the command: tiup ctl:v5.4.0 pd store -u http://192.168.0.44:2379 shows the following information. Can any experts provide some guidance? This newbie is encountering TiDB for the first time, and the cluster was not set up by me. I temporarily took over the maintenance. Could it be that the capacity of other TiKV nodes is insufficient, causing the region to be unable to migrate? Thank you very much for the opinions of all the experts.
{
“count”: 5,
“stores”: [
{
“store”: {
“id”: 54569104,
“address”: “192.168.0.77:20160”,
“version”: “5.4.0”,
“status_address”: “192.168.0.77:20180”,
“git_hash”: “b5262299604df88711d9ed4b84d43e9c507749a2”,
“start_timestamp”: 1688780698,
“deploy_path”: “/home/tidb/tidb-deploy/tikv-20160/bin”,
“last_heartbeat”: 1689855671702792664,
“state_name”: “Up”
},
“status”: {
“capacity”: “3.581TiB”,
“available”: “504GiB”,
“used_size”: “2.846TiB”,
“leader_count”: 63632,
“leader_weight”: 1,
“leader_score”: 63632,
“leader_size”: 5944706,
“region_count”: 151913,
“region_weight”: 1,
“region_score”: 25440050.958300572,
“region_size”: 14185296,
“slow_score”: 1,
“start_ts”: “2023-07-08T09:44:58+08:00”,
“last_heartbeat_ts”: “2023-07-20T20:21:11.702792664+08:00”,
“uptime”: “298h36m13.702792664s”
}
},
{
“store”: {
“id”: 54570781,
“address”: “192.168.0.88:20160”,
“version”: “5.4.0”,
“status_address”: “192.168.0.88:20180”,
“git_hash”: “b5262299604df88711d9ed4b84d43e9c507749a2”,
“start_timestamp”: 1688780748,
“deploy_path”: “/home/tidb/tidb-deploy/tikv-20160/bin”,
“last_heartbeat”: 1689855676107451361,
“state_name”: “Up”
},
“status”: {
“capacity”: “3.581TiB”,
“available”: “518GiB”,
“used_size”: “2.832TiB”,
“leader_count”: 63629,
“leader_weight”: 1,
“leader_score”: 63629,
“leader_size”: 5854555,
“region_count”: 152668,
“region_weight”: 1,
“region_score”: 25096307.24491983,
“region_size”: 14087928,
“slow_score”: 1,
“start_ts”: “2023-07-08T09:45:48+08:00”,
“last_heartbeat_ts”: “2023-07-20T20:21:16.107451361+08:00”,
“uptime”: “298h35m28.107451361s”
}
},
{
“store”: {
“id”: 435001,
“address”: “192.168.0.44:20160”,
“state”: 1,
“version”: “5.4.0”,
“status_address”: “192.168.0.44:20180”,
“git_hash”: “b5262299604df88711d9ed4b84d43e9c507749a2”,
“start_timestamp”: 1679173957,
“deploy_path”: “/home/tidb/tidb-deploy/tikv-20160/bin”,
“last_heartbeat”: 1679277434699257976,
“state_name”: “Offline”
},
“status”: {
“capacity”: “0B”,
“available”: “0B”,
“used_size”: “0B”,
“leader_count”: 0,
“leader_weight”: 1,
“leader_score”: 0,
“leader_size”: 0,
“region_count”: 153072,
“region_weight”: 1,
“region_score”: 14102765,
“region_size”: 14102765,
“slow_score”: 0,
“start_ts”: “2023-03-19T05:12:37+08:00”,
“last_heartbeat_ts”: “2023-03-20T09:57:14.699257976+08:00”,
“uptime”: “28h44m37.699257976s”
}
},
{
“store”: {
“id”: 441829,
“address”: “192.168.0.55:20160”,
“version”: “5.4.0”,
“status_address”: “192.168.0.55:20180”,
“git_hash”: “b5262299604df88711d9ed4b84d43e9c507749a2”,
“start_timestamp”: 1689145062,
“deploy_path”: “/home/tidb/tidb-deploy/tikv-20160/bin”,
“last_heartbeat”: 1689855666887176027,
“state_name”: “Up”
},
“status”: {
“capacity”: “3.581TiB”,
“available”: “490.6GiB”,
“used_size”: “2.853TiB”,
“leader_count”: 63626,
“leader_weight”: 1,
“leader_score”: 63626,
“leader_size”: 5817870,
“region_count”: 153919,
“region_weight”: 1,
“region_score”: 25474172.258108985,
“region_size”: 14090076,
“slow_score”: 1,
“start_ts”: “2023-07-12T14:57:42+08:00”,
“last_heartbeat_ts”: “2023-07-20T20:21:06.887176027+08:00”,
“uptime”: “197h23m24.887176027s”
}
},
{
“store”: {
“id”: 443528,
“address”: “192.168.0.66:20160”,
“version”: “5.4.0”,
“status_address”: “192.168.0.66:20180”,
“git_hash”: “b5262299604df88711d9ed4b84d43e9c507749a2”,
“start_timestamp”: 1689144954,
“deploy_path”: “/home/tidb/tidb-deploy/tikv-20160/bin”,
“last_heartbeat”: 1689855668354806741,
“state_name”: “Up”
},
“status”: {
“capacity”: “3.581TiB”,
“available”: “477.2GiB”,
“used_size”: “2.865TiB”,
“leader_count”: 63636,
“leader_weight”: 1,
“leader_score”: 63636,
“leader_size”: 5884687,
“region_count”: 152082,
“region_weight”: 1,
“region_score”: 25589442.485215813,
“region_size”: 14047393,
“slow_score”: 1,
“start_ts”: “2023-07-12T14:55:54+08:00”,
“last_heartbeat_ts”: “2023-07-20T20:21:08.354806741+08:00”,
“uptime”: “197h25m14.354806741s”
}
}
]
}