Note:
This topic has been translated from a Chinese forum by GPT and might contain errors.
Original topic: 某个tikv节点全程划水(几乎不处理请求)
【TiDB Usage Environment】Production Environment / Testing / PoC
【TiDB Version】6.5.5
【Reproduction Path】What operations were performed to cause the issue
【Encountered Issue: Issue Phenomenon and Impact】
【Resource Configuration】Enter TiDB Dashboard - Cluster Info - Hosts and take a screenshot of this page
【Attachments: Screenshots/Logs/Monitoring】
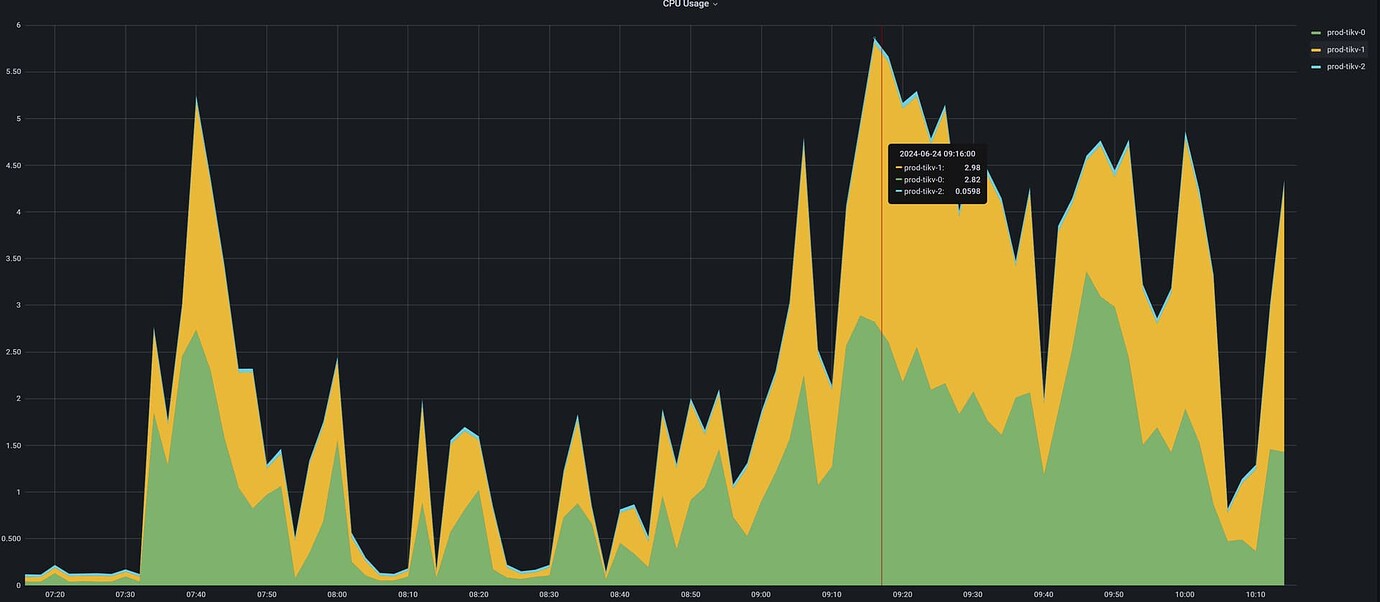
The system is very slow, and there are many slow queries in the database. The CPU usage of the TiKV nodes exceeds 80%, but there is one TiKV node whose CPU is almost unused throughout, indicating a serious load imbalance. My TiKV nodes have 4 cores and are deployed on k8s.
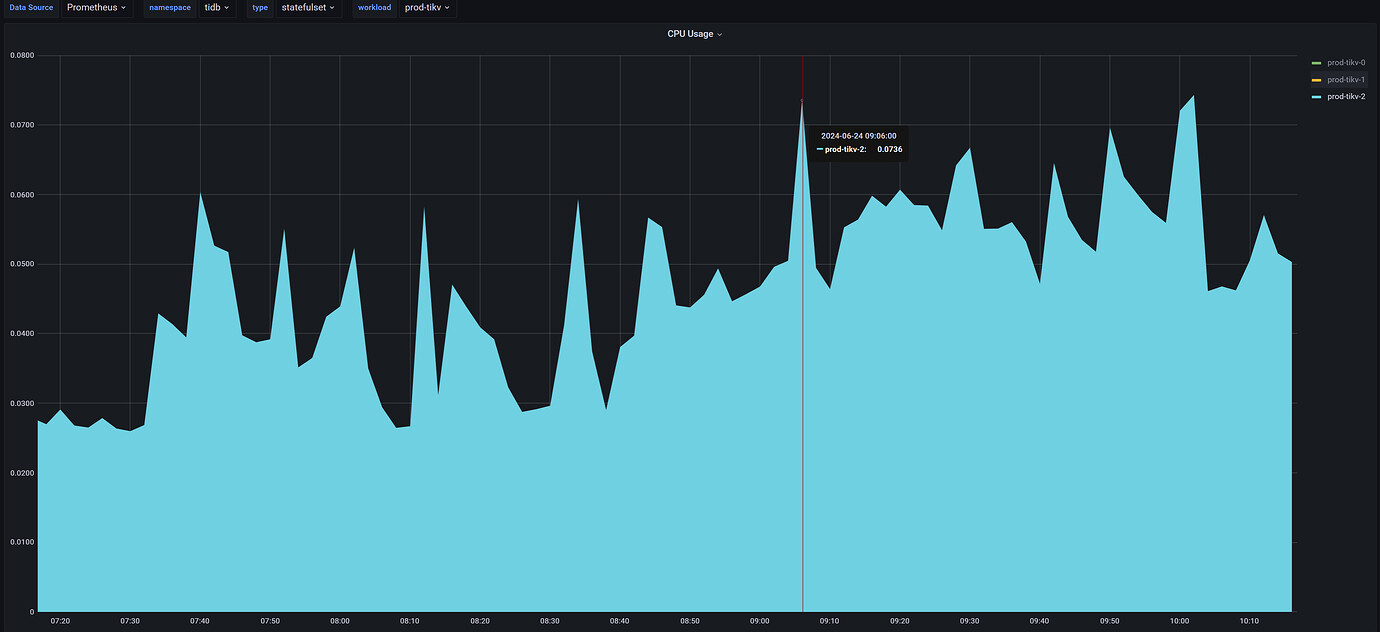
Looking at tikv-2 alone, it is almost idle throughout
I checked the corresponding TiKV logs, and there are no error logs, only info logs.
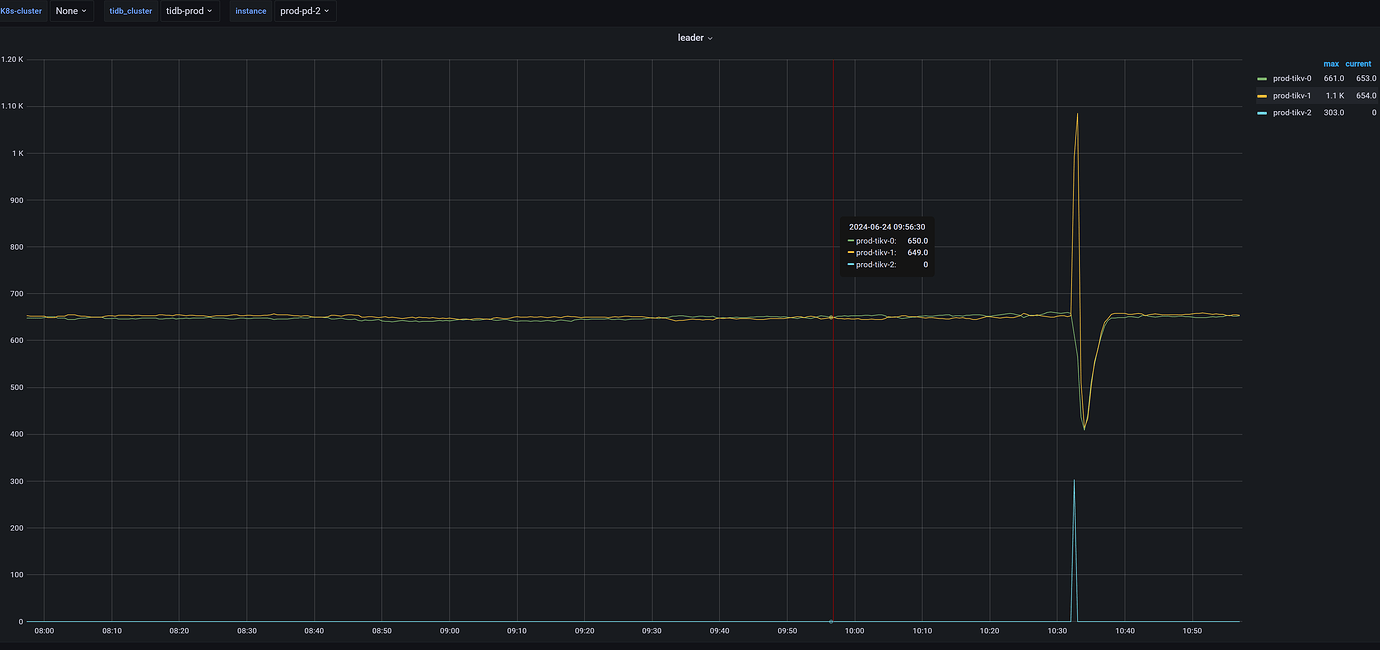
The load is severely unbalanced. Is there not a single leader above?
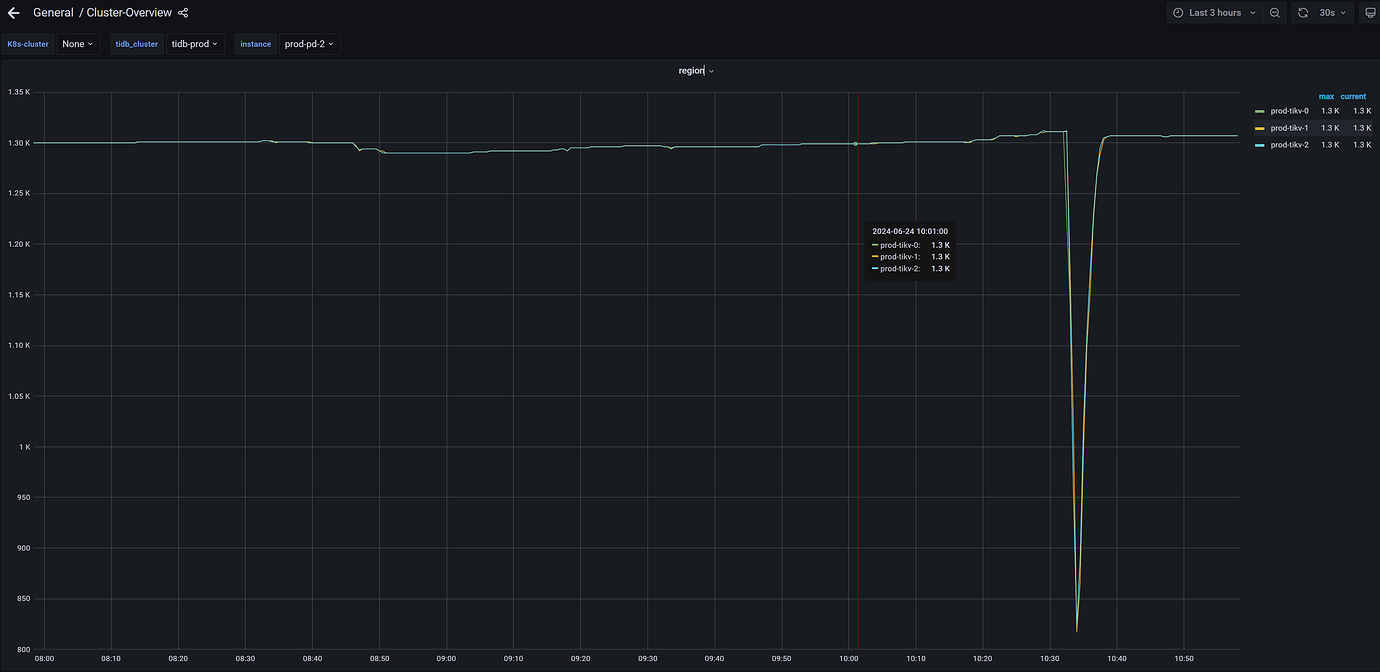
Check the number of regions and leaders.
The distribution of leaders is uneven, they are all followers.
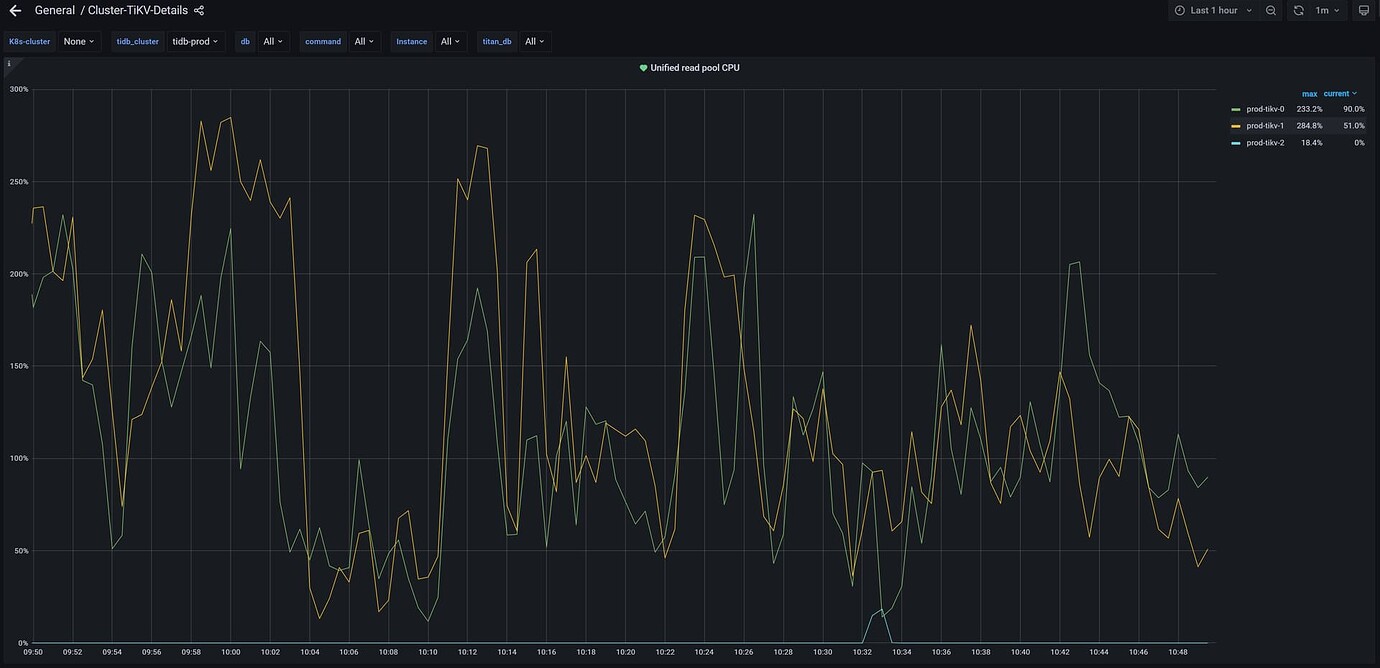
Use TiDB’s monitoring tools (such as Grafana) and diagnostic logs to check the load status, data distribution, and GC status of TiKV nodes.
Open the TiDB Dashboard cluster information and check the host. Look at this graph and observe the average CPU usage and memory usage. If one is particularly high and the other is particularly low, it is basically the leader and follower. If the 999 latency is very low, you don’t need to handle it.
Check which node your hotspot table is distributed on. Analyze the SQL through the TiDB dashboard.
The system has stabilized now, and the differences are not significant.
Where is the heatmap monitoring? There are too many monitoring options, I really couldn’t find it.
The default value of tidb_dml_batch_size is 20000.