A very simple SQL took 16 minutes, but checking the "execution time" doesn't show where the time was spent specifically, SQL: ANALYZE TABLE XXX

Note:
This topic has been translated from a Chinese forum by GPT and might contain errors.

Original topic: 一个非常简单的SQL耗时16分钟,但查看“执行时间”,看不到具体时间消耗在哪里,sql:ANALYZE TABLE XXX

| username: tidb_bruce

To improve efficiency, please provide the following information. A clear problem description can help resolve the issue faster:

[TiDB Usage Environment]
Production Environment
[Overview] Scenario + Problem Overview
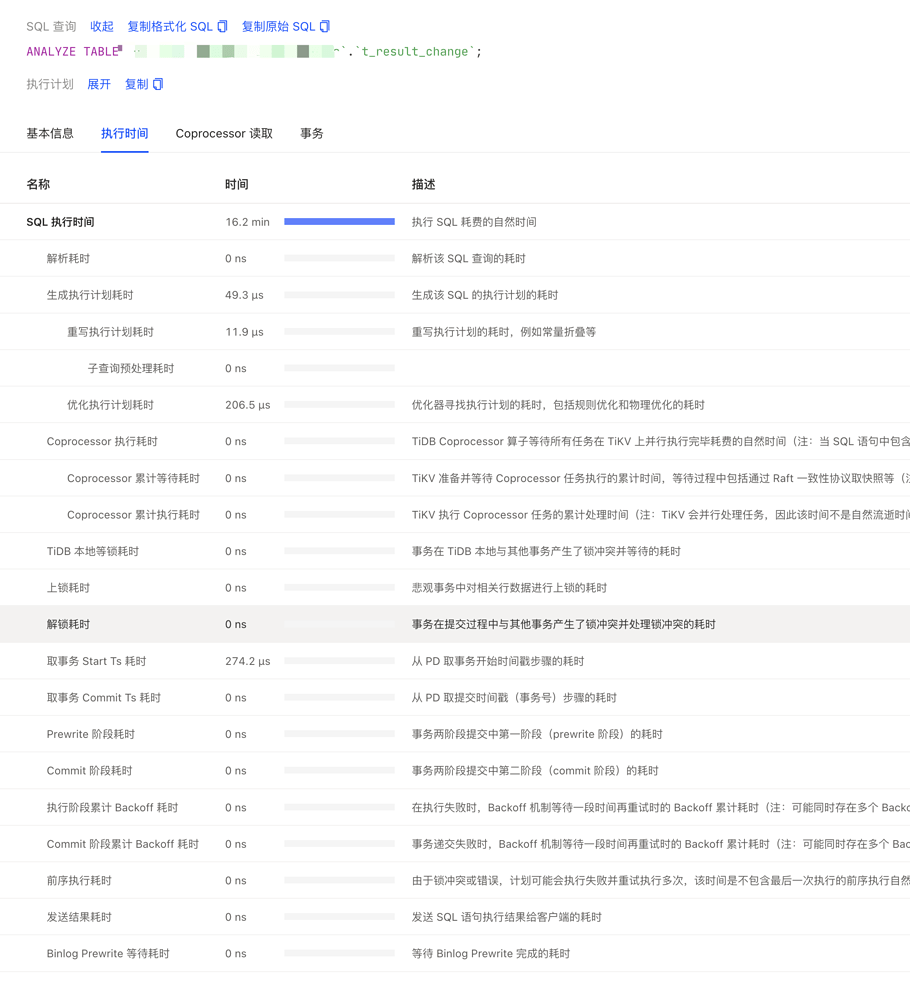
The cluster suddenly became slow. By checking the slow logs, I found a very strange SQL. It was just an ANALYZE, but it took more than ten minutes.
The execution time is as follows:

[Background] Operations performed

[Phenomenon] Business and database phenomena

[Problem] Current issue encountered

[Business Impact]

[TiDB Version]
5.2.1
[Application Software and Version]

[Attachments] Relevant logs and configuration information

  • TiUP Cluster Display information
  • TiUP Cluster Edit config information

Monitoring (https://metricstool.pingcap.com/)

  • TiDB-Overview Grafana monitoring
  • TiDB Grafana monitoring
  • TiKV Grafana monitoring
  • PD Grafana monitoring
  • Corresponding module logs (including logs 1 hour before and after the issue)

If the question is related to performance optimization or troubleshooting, please download the script and run it. Please select all and copy-paste the terminal output results and upload them.

| username: Kongdom | Original post link

This is the automatic collection of statistics in TiDB, and you can set parameters to disable automatic collection during the day.

| username: tidb_bruce | Original post link

It is indeed possible to disable automatic collection, but that only addresses the symptoms, not the root cause. I want to find out the specific reason behind it.

| username: songxuecheng | Original post link

It is related to the amount of data in the table. If you want to speed up, you can adjust the parameters, which may affect the cluster.

| username: tidb_bruce | Original post link

Okay, thank you, thank you.

| username: Hacker007 | Original post link

This is quite resource-intensive. You can set it to avoid peak periods, which can significantly reduce resource consumption.

| username: tidb狂热爱好者 | Original post link

Two methods:

  1. Specify the analyze time to avoid peak periods:
set global tidb_auto_analyze_start_time='01:00 +0000';
set global tidb_auto_analyze_end_time='01:00 +0000';
  1. Use partitioned tables. Execute partitioning.

The reason you can’t see the execution result is that the SQL hasn’t finished running and was canceled.

| username: system | Original post link

This topic was automatically closed 60 days after the last reply. New replies are no longer allowed.