Note:
This topic has been translated from a Chinese forum by GPT and might contain errors.
Original topic: 集群流量异常
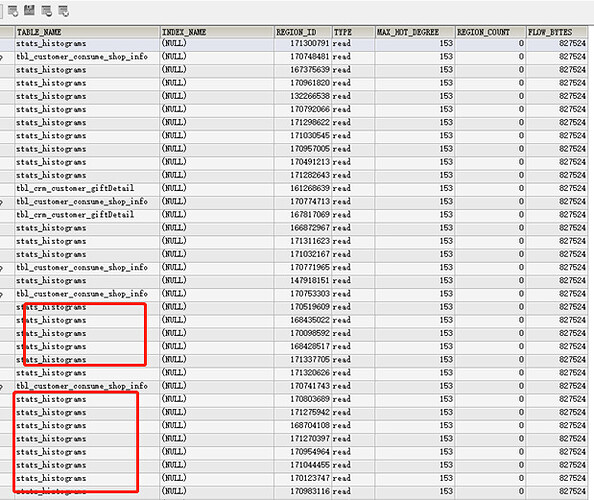
Cluster traffic is abnormal. By checking TIDB_HOT_REGIONS,
most of it is from the table stats_histograms. The analyze parameters are set as shown in the following image:

How can this large traffic be controlled effectively?
Did the analysis not consider the time zone? It needs to be changed to +0800 to match our local time.
V4.0.9, this happened in the last 2 days.
Well, this cluster has been running for more than a year. TiDB is using a gigabit network card. In recent days, at certain times, the network card is completely saturated. According to nethogs, the TiDB-SERVER network traffic received reaches 100MB/s.
Are there slow queries in the slow log?
The network of the TIDB-SERVER machine is fully utilized:
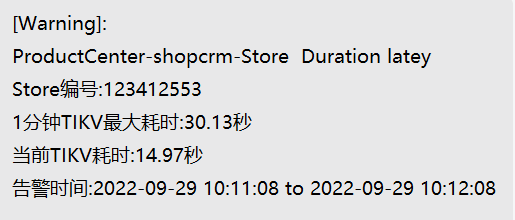
Triggering high latency in TIKV responses:

The request latency on the tidb-server node is also quite high, causing the overall cluster response to be slow.
The issue with the MYSQL table statement hasn’t been identified. Under normal circumstances, SQL requests for business tables in the cluster are very fast.
I suggest adjusting the time range for analyze and observing again. With the current settings, it should now be within the automatic analyze interval.
The high traffic received by the TiDB server could also be due to issues with the SQL execution plan. Check if there are any anomalies or changes in the slow SQL.
It is best to observe through Prometheus first, see which nodes have abnormal network traffic, and then conduct troubleshooting.
Several TiKV nodes are sending data to the TiDB server, and the total traffic is overwhelming the TiDB server nodes.
The business SQL has basically not changed, and the newly added SQL queries are all very fast.
Okay, I’ll observe it tonight.
Collecting statistics too frequently has caused a hotspot. Change 0.5 to 0.6 and make some adjustments.
When was the last analyze on this table, and what is the health status of the table?
Hmm, another wave just came.
There are many tables with low health in the business tables. TiDB data is written through DM, and frequent changes in the business tables can easily lead to lower monitoring levels.
The time period for statistics can be shorter, limited to off-peak business hours or at night.


