Note:
This topic has been translated from a Chinese forum by GPT and might contain errors.Original topic: TIKV各种锁持续时间异常,TIDB GC无法正常执行
[TiDB Usage Environment] Production Environment
[TiDB Version] v5.4.0
[Reproduction Path] None
[Encountered Issues: Problem Phenomenon and Impact]
Issues:
- TiKV continuously receives related alerts, unable to eliminate [TiKV scheduler latch wait duration seconds more than 1s], [TiKV scheduler context total]
- TIDB GC process cannot proceed normally
- Client logs report Tikv server is busy
=========
Personal Investigation Results:
The current cluster had Juicefs metadata cluster added yesterday, with only Juicefs client. These issues appeared after some time of use.
I looked for official related alert handling but couldn’t find anything matching the issues I encountered.
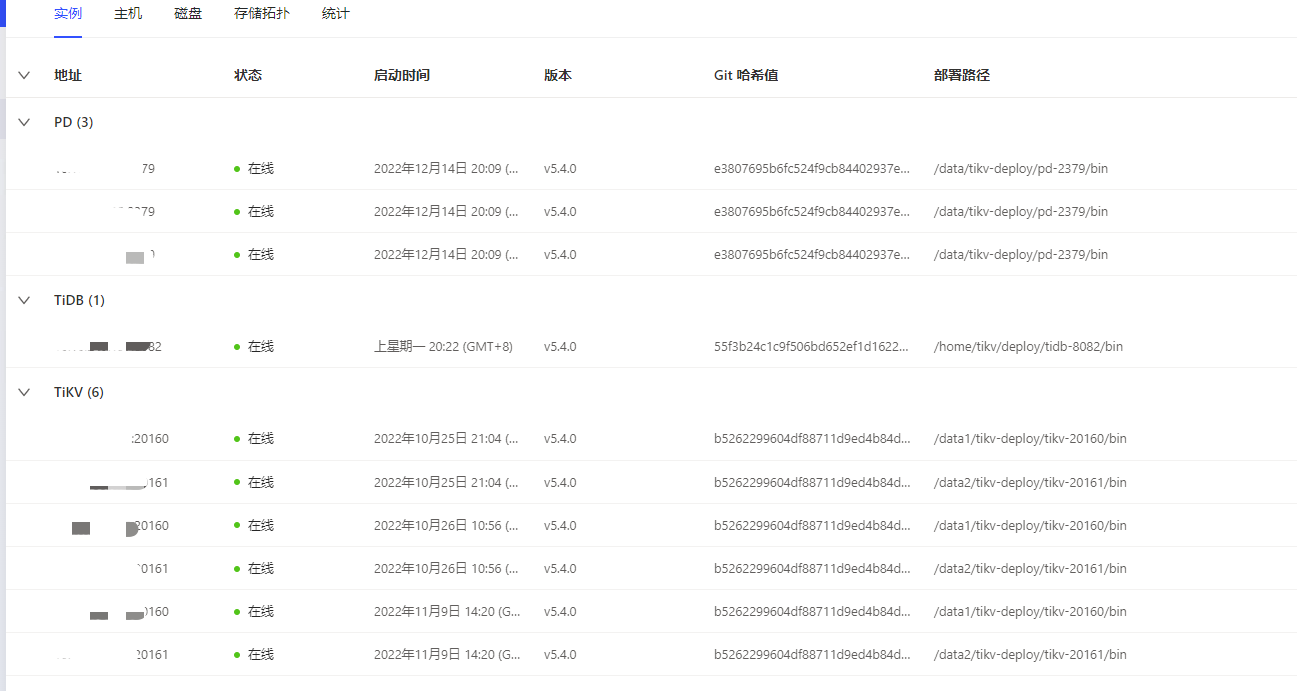
[Resource Configuration]
3 physical machines, each with 2 NVME disks, each machine deployed with 2 TiKV instances
[Attachments: Screenshots/Logs/Monitoring]
===============================Related Monitoring Screenshots====================
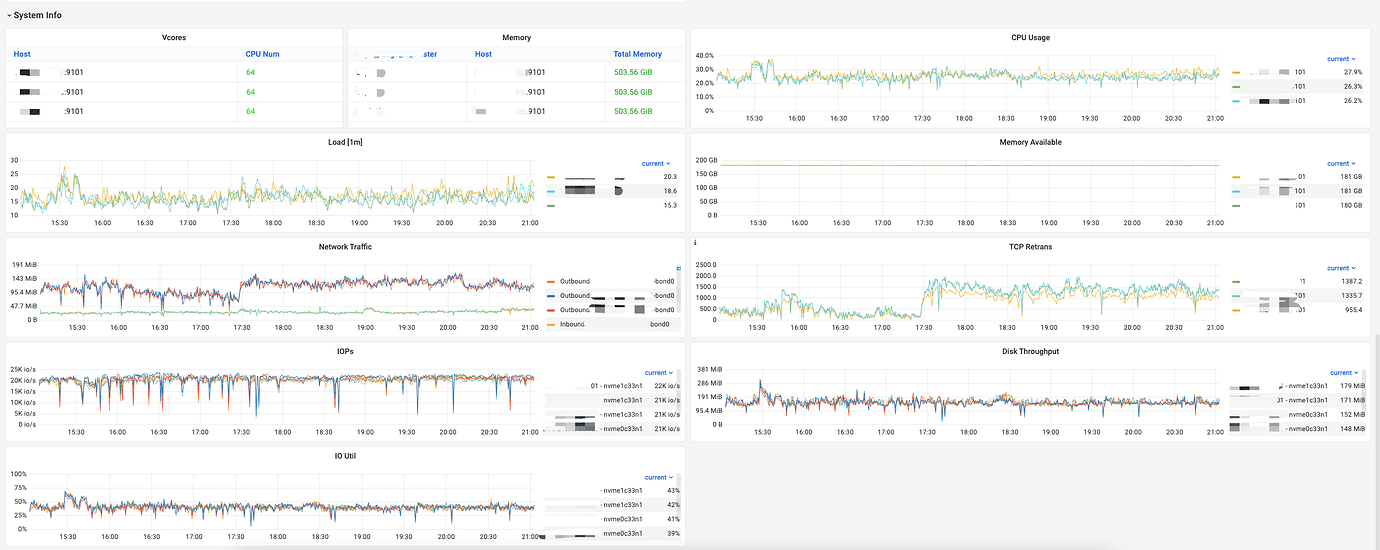
-
Machine Performance Monitoring:
Overall machine resource usage is not high
-
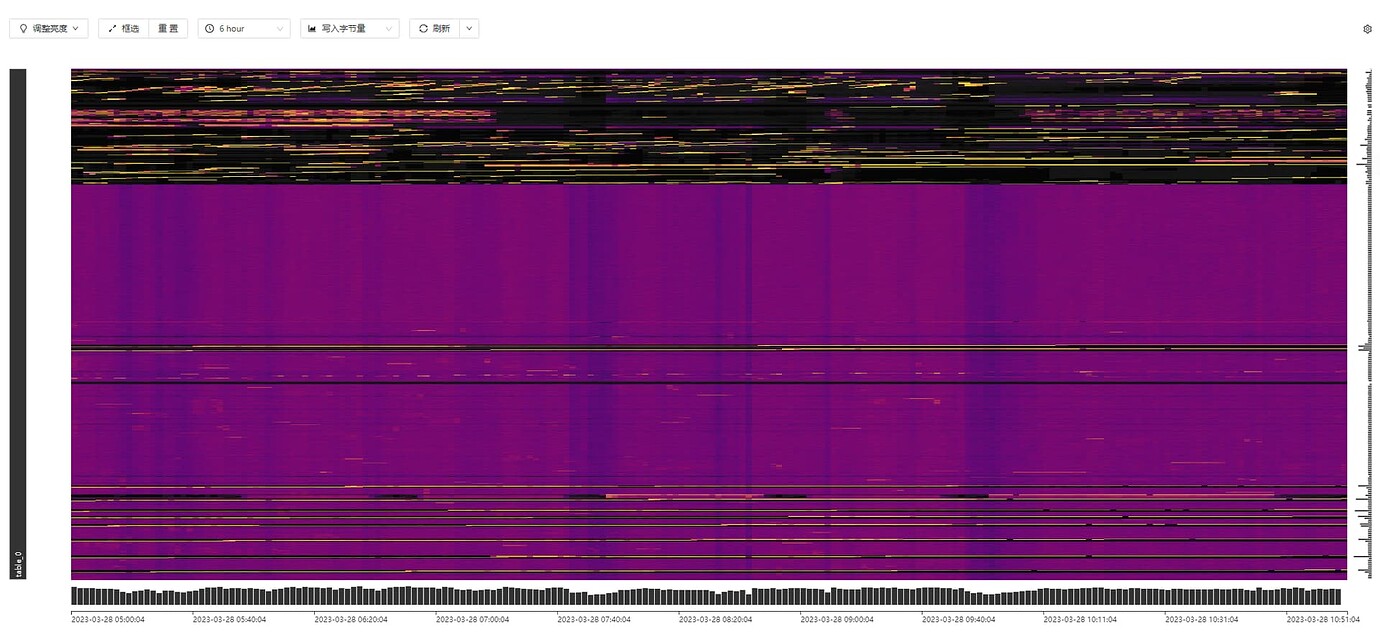
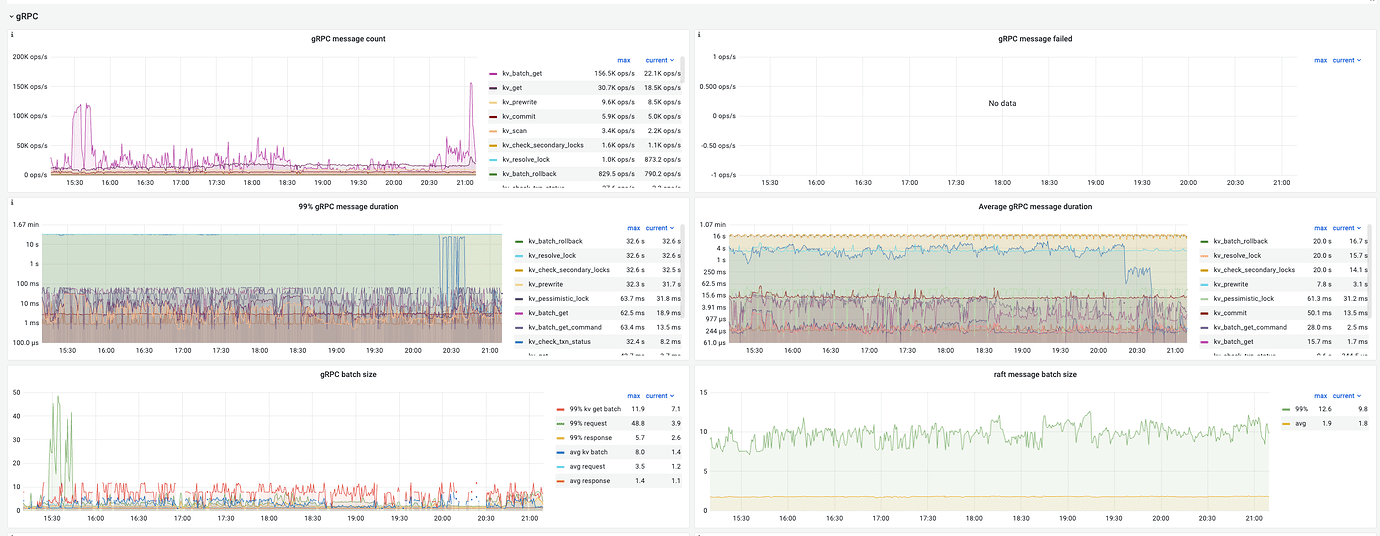
gRPC Related Monitoring:
Various locks last for a very long time
-
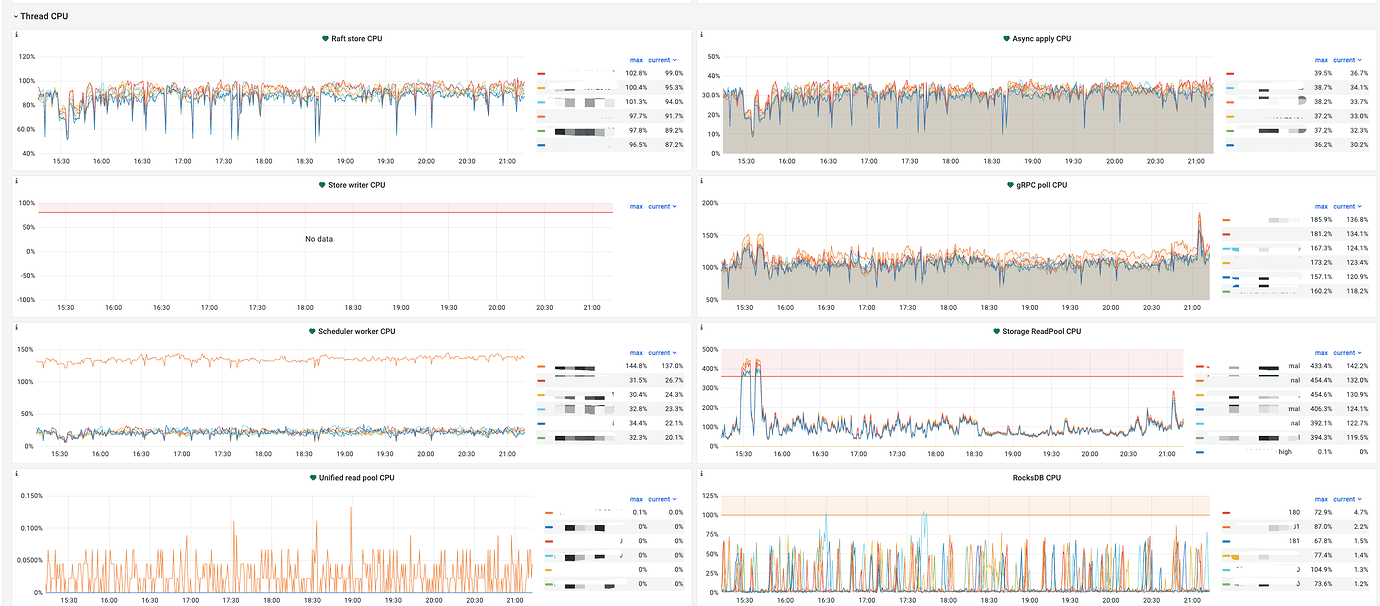
CPU Monitoring of Each Component:
One of the TiKV scheduler CPUs is consistently higher than the other 5 TiKVs
-
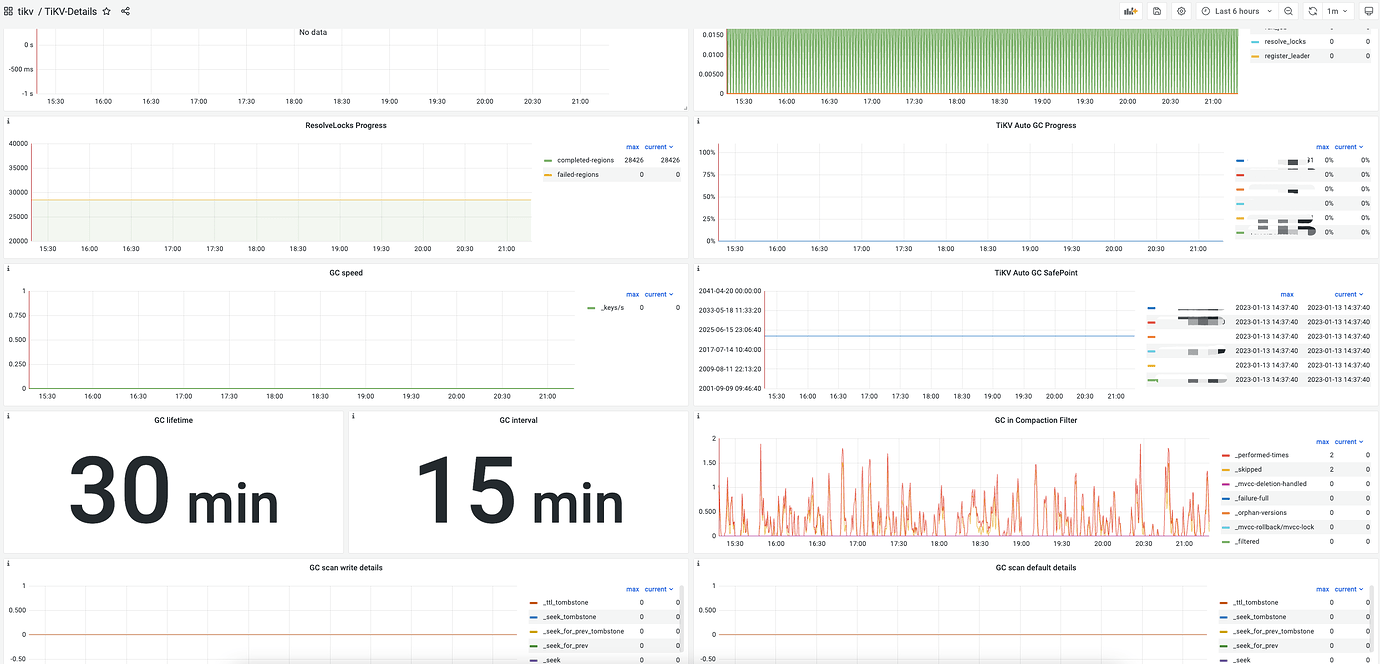
GC Related Panel:
GC savepoint stays at a very old point
==============================Related Log Screenshots=================
TiDB Logs:
Server is busy logs are all for the same region id
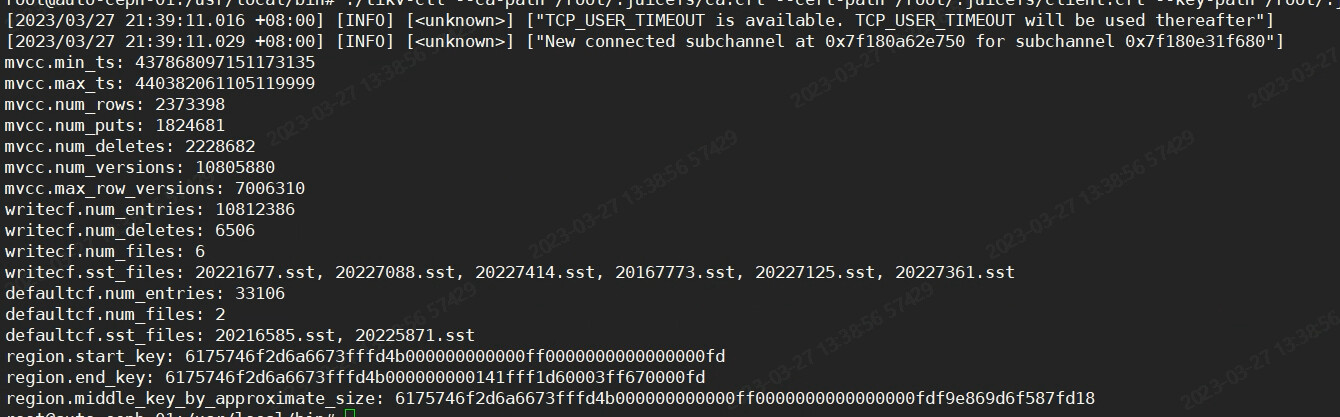
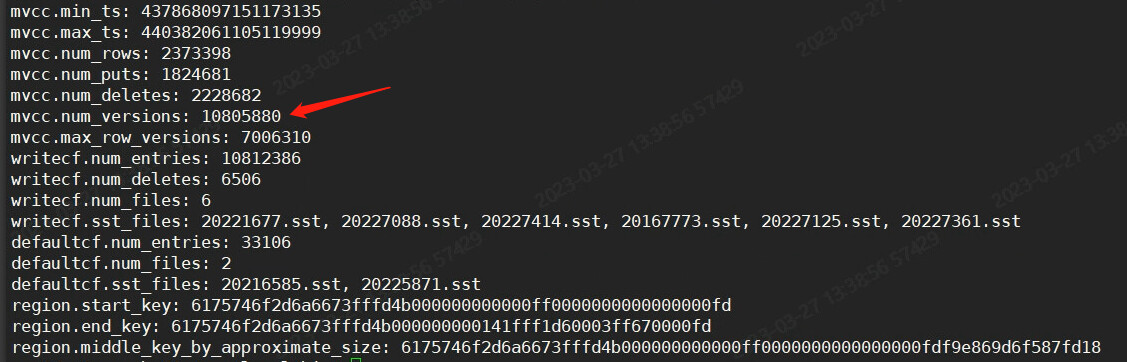
GC Related Logs:

TiKV Scheduler CPU Abnormal Logs:
A large number of the following warning logs
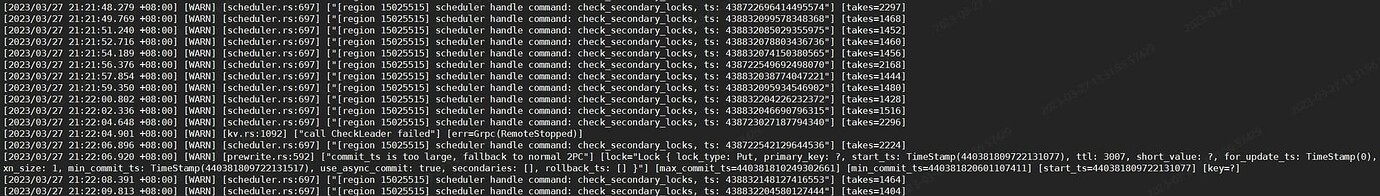
Region Information Involved in Logs: