Note:
This topic has been translated from a Chinese forum by GPT and might contain errors.
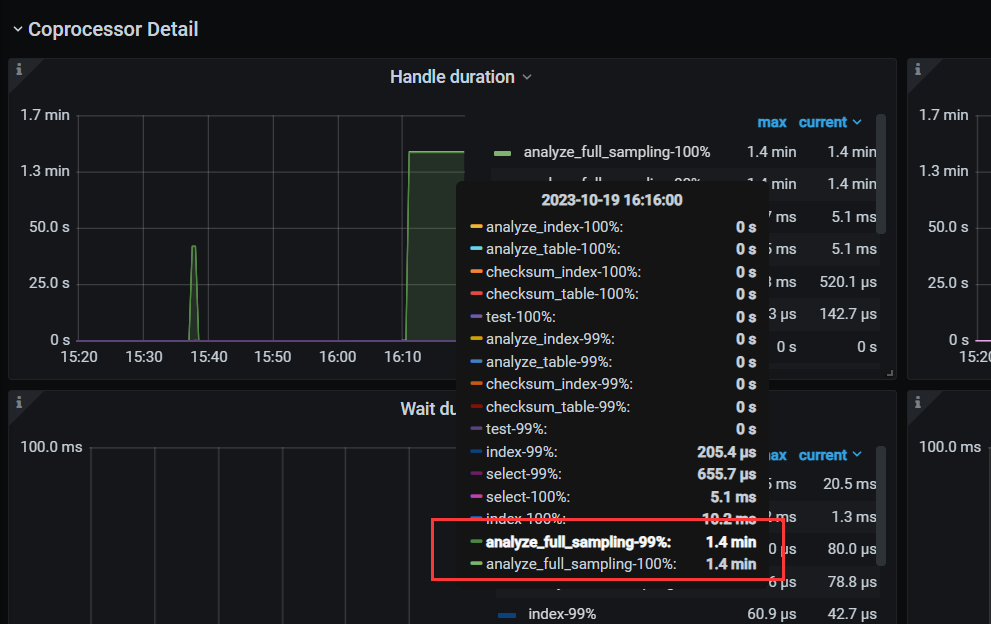
Original topic: coprocessor handle和wait duration 监控显示异常
This anomaly. Which parameters of the coprocessor should be optimized? readpool.coprocessor.normal-concurrency is currently set to 19.
The analyze_full_sampling is for automatically collecting statistics, right? It shouldn’t affect the business. Are you experiencing any impact on your business now?
Affecting business, currently still in testing state, the dashboard page occasionally shows slow queries, and the slow queries displayed also include analyze statements.
I couldn’t find the analyze_full_sampling parameter in version v7.1.1.
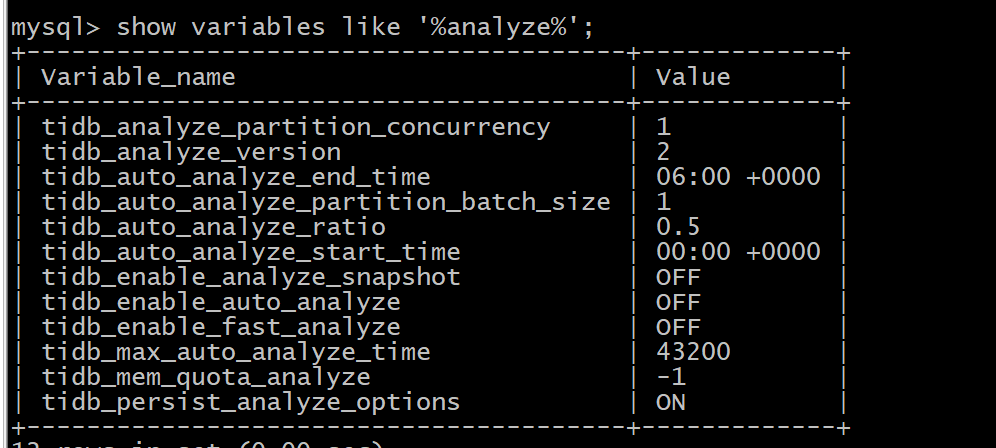
The currently visible analyze parameters are as follows:
tidb_enable_auto_analyze shows off, which I just turned off.
Is your cluster large?
There is an issue with the timing of your automatic statistics collection task. Change it to start at 00:00 +0800 and end at 06:00 +0800. Currently, you have it set to start at 8 AM and end at 2 PM Beijing time.
It is still in the testing phase. If it is used in the future, the scale will be quite large. There will be no problem with the data volume exceeding 10TB.
Okay, I’ll make some adjustments to the timing.
If you have very large tables, it is not recommended to use automatic collection because it is single-threaded and may take a long time and might not succeed. It is recommended to manually deploy scripts to modify concurrency parameters and collect large tables proportionally.
Regarding the collection part, I clearly turned off the automatic collection function, so why is it still showing in the cluster? I turned it off at 15:50.
Where can I find the `analyze_full_sampling` parameter?