Note:
This topic has been translated from a Chinese forum by GPT and might contain errors.
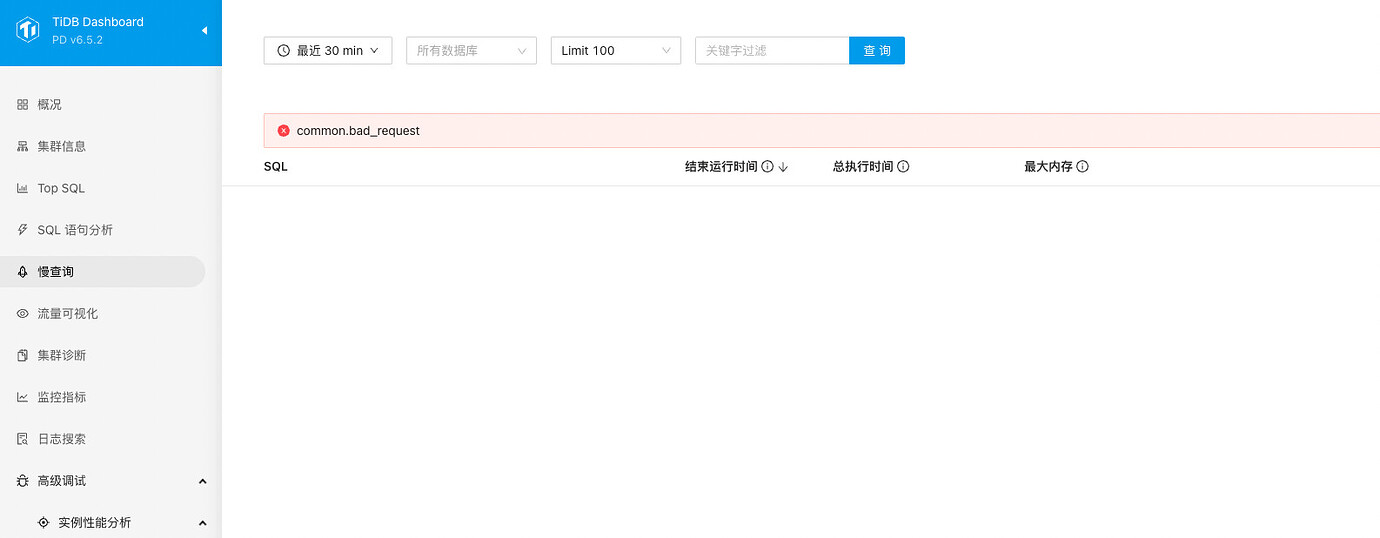
Original topic: tidb-dashboard 查询异常
[TiDB Usage Environment] Production Environment / Test / Poc
[TiDB Version] v6.5.2
[Reproduction Path] What operations were performed to cause the issue
[Encountered Issue: Issue Phenomenon and Impact]
[Resource Configuration] Enter TiDB Dashboard - Cluster Info - Hosts and take a screenshot of this page
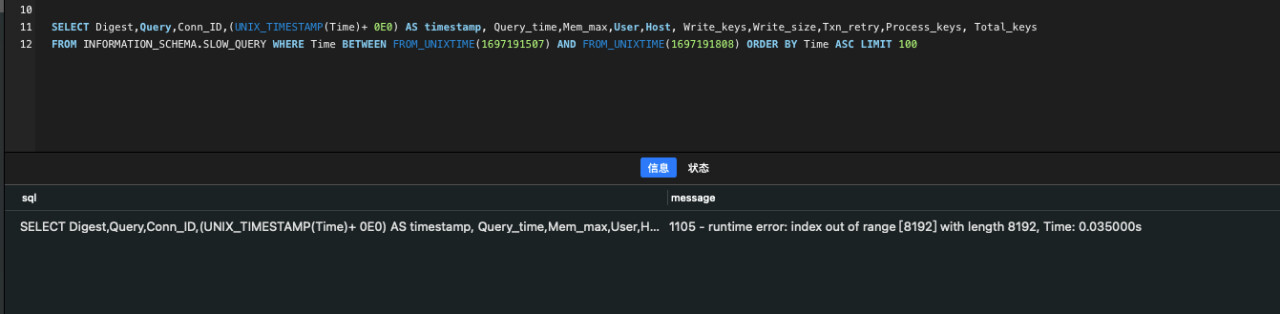
Directly query through the console:
SELECT Digest, Query, Conn_ID, (UNIX_TIMESTAMP(Time) + 0E0) AS timestamp, Query_time, Mem_max, User, Host, Write_keys, Write_size, Txn_retry, Process_keys, Total_keys
FROM INFORMATION_SCHEMA.SLOW_QUERY WHERE Time BETWEEN FROM_UNIXTIME(1697191507) AND FROM_UNIXTIME(1697191808) ORDER BY Time ASC LIMIT 100
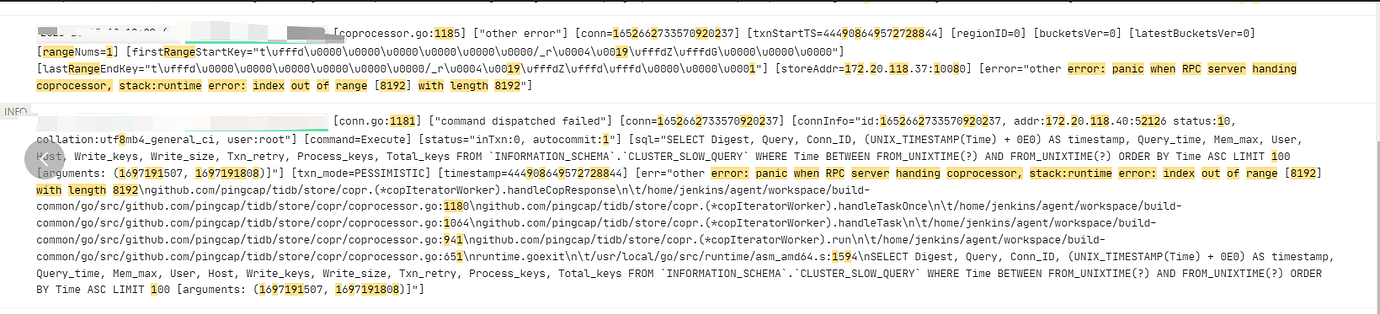
Returns an error:
1105 - runtime error: index out of range [8192] with length 8192, Time: 0.035000s
[Attachment: Screenshot/Log/Monitoring]
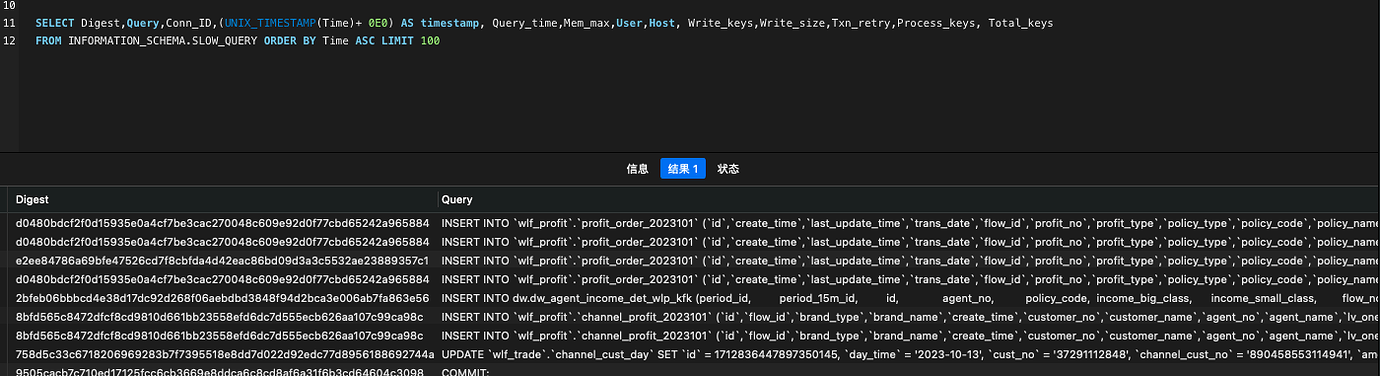
Query results are normal without adding time.
There are too many historical slow logs, delete them from the host.
Try restarting the dashboard.
There are too many logs. Generally, you can delete all the slow*.log files under /data/tidb-deploy/tidb-4000/logs. Then restart the service with service restart tidb-4000.
Too much history, can’t keep up, need to clean some of it up.
Try clearing the slow query logs and then test again.
I have already restarted the tidb-dashboard, but the issue remains unresolved.
The slow query logs have been cleared, but the issue persists. The tidb-server service has not been restarted.
Restart the tidb-server at an appropriate time to check if it resolves the issue.
I also encountered a similar issue. Later, I reduced the number of displayed columns and increased the slow log threshold to make the slow log smaller, which resolved the problem.
Yes, displaying too many columns and having a long save time can also cause this error. I have encountered this occasionally before.
I feel this issue is a defect.
I suspect there’s no problem. However, if it’s difficult to reproduce, it will also be difficult to resolve.
I suggest using PLAN REPLAYER to save the cluster’s current state information, and then submit an issue on GitHub with it as an attachment. Let’s see if we can pinpoint the cause.
Cleared the slow query logs… It has been restored. If any anomalies are found, collect the cluster information.
Write a script to create a scheduled task to regularly clean up slow logs.
This topic was automatically closed 60 days after the last reply. New replies are no longer allowed.