Note:
This topic has been translated from a Chinese forum by GPT and might contain errors.Original topic: SQL 执行计划异常
[TiDB Usage Environment] Production Environment
[TiDB Version] TiDB-v6.1.3
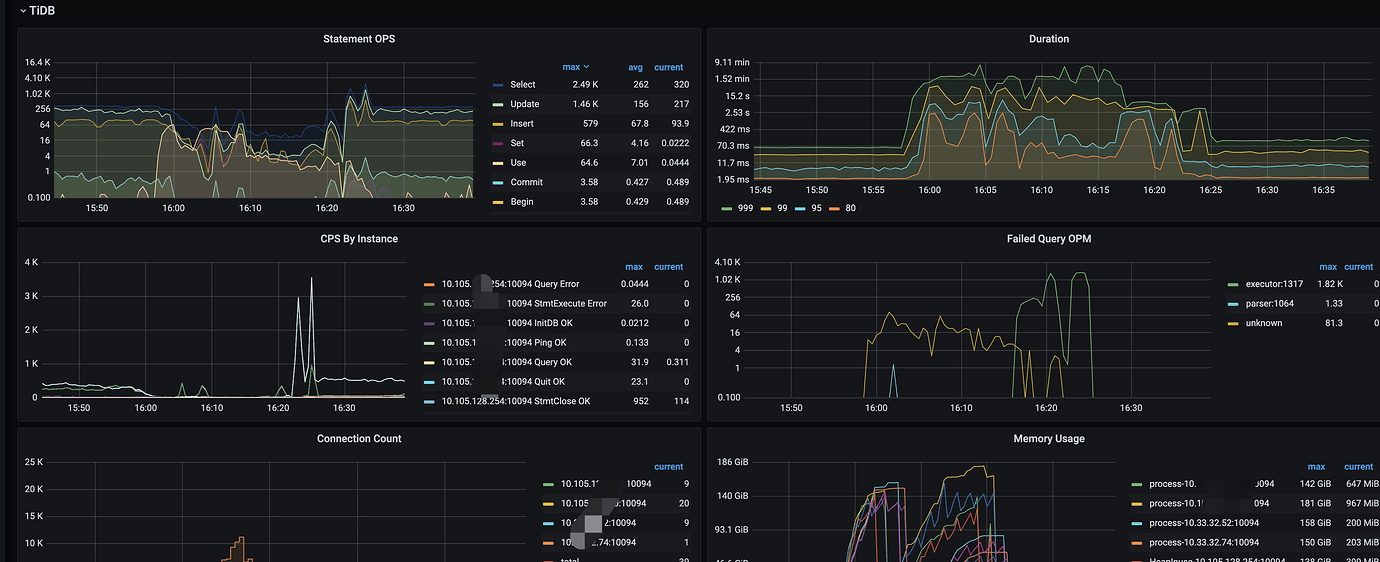
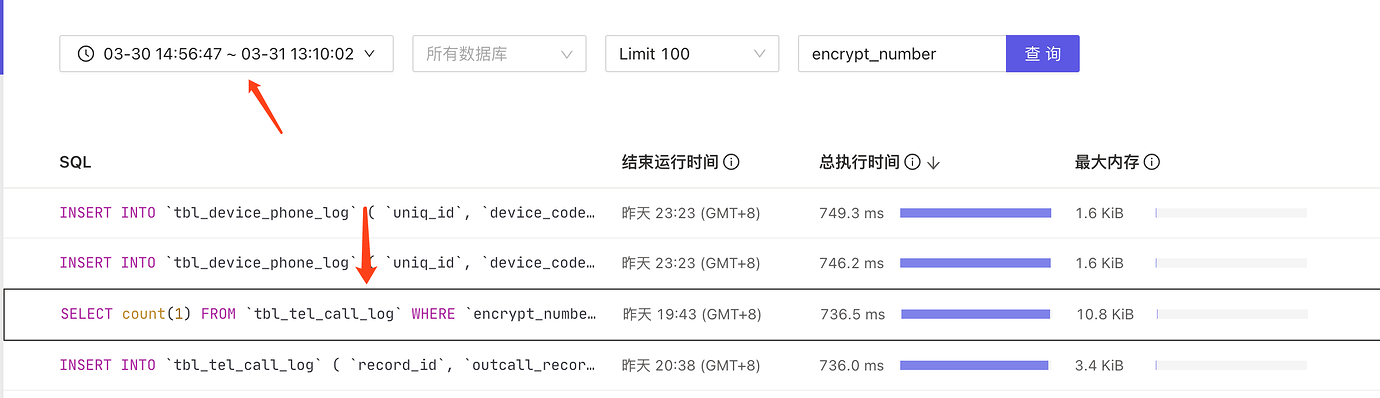
Problem encountered: The cluster suddenly slowed down. Upon logging in, I found a SQL statement being executed in large quantities, causing the TIKV-CPU to max out.
The table structure is as follows:
CREATE TABLE `tbl_tel_call_log` (
  `record_id` varchar(100) NOT NULL DEFAULT '' COMMENT 'Call record ID',
  `ext_data` text NOT NULL COMMENT 'Extended field',
  `source` tinyint(4) unsigned NOT NULL DEFAULT '0' COMMENT 'Source',
  .........
  `called_name` varchar(40) NOT NULL DEFAULT '' COMMENT 'Called party name',
  `call_type` tinyint(4) NOT NULL DEFAULT '0' COMMENT 'Call type, 1-outgoing, 2-incoming',
  `call_status` tinyint(4) NOT NULL DEFAULT '0' COMMENT 'Status, 1-successful downstream call, 2-in call, 3-call successfully ended, 4-call failed (ringing not answered), 5-call failed (no ringing)',
  `duration` int(10) NOT NULL DEFAULT '0' COMMENT 'Call duration (in seconds)',
  `agent_ring_time` int(10) NOT NULL DEFAULT '0' COMMENT 'Agent ring time',
  .......
  `record_file` varchar(500) NOT NULL DEFAULT '' COMMENT 'Call recording file COS object name',
  `display_number` varchar(20) NOT NULL DEFAULT '' COMMENT 'Display number of the called party',
  `encrypt_number` varchar(100) NOT NULL DEFAULT '' COMMENT 'Masked number of the called party',
  `create_name` varchar(40) NOT NULL DEFAULT '' COMMENT 'Creator - email prefix',
  `create_time` int(10) unsigned NOT NULL DEFAULT '0' COMMENT 'Creation time',
  `update_time` int(10) unsigned NOT NULL DEFAULT '0' COMMENT 'Update time',
  `last_modify_time` timestamp NOT NULL DEFAULT CURRENT_TIMESTAMP ON UPDATE CURRENT_TIMESTAMP COMMENT 'Last update time of the data table',
  `device_env` tinyint(4) NOT NULL DEFAULT '0' COMMENT 'Device flashing status',
  `device_uniq_id` varchar(40) NOT NULL DEFAULT '' COMMENT 'Device internal code',
  PRIMARY KEY (`record_id`) /*T![clustered_index] NONCLUSTERED */,
  KEY `idx_call_name` (`call_name`),
  KEY `idx_record_id` (`record_id`),
  KEY `idx_called_uid` (`called_uid`),
  KEY `idx_call_status` (`call_status`),
  KEY `idx_encrypt_time` (`encrypt_number`,`create_time`),
  KEY `idx_outcall_record_id` (`outcall_record_id`),
  KEY `idx_call_id` (`call_id`),
  KEY `idx_create_time_role` (`create_time`,`role`)
) ENGINE=InnoDB DEFAULT CHARSET=utf8mb4 COLLATE=utf8mb4_bin /*T! SHARD_ROW_ID_BITS=4 */
The slow SQL is as follows:
SELECT count(1) FROM `tbl_tel_call_log` WHERE `encrypt_number` = '0415df6acde779843ac1b2172db07bbdb5c486662d002ffb' AND create_time >= 1680105600 and call_status in (3,5,31);
When the problem occurred, the execution plan viewed on the dashboard used the wrong index KEY idx_call_status (call_status)
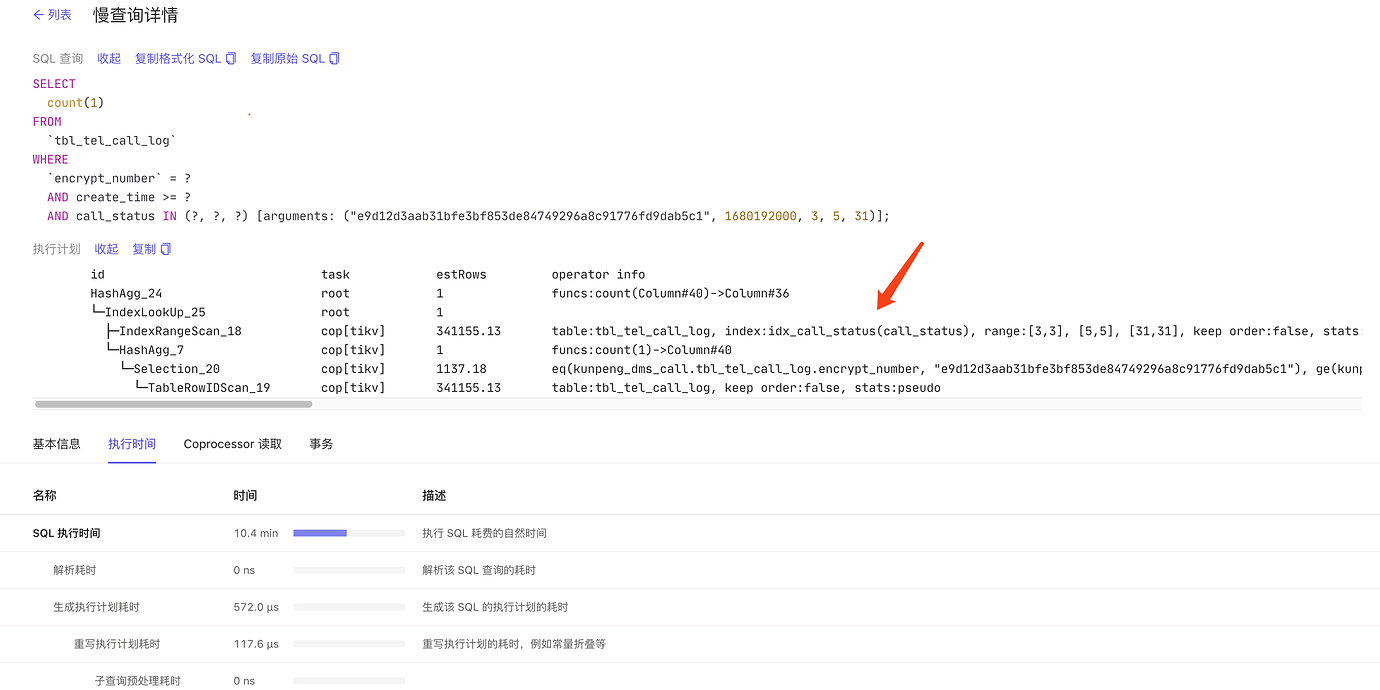
The execution plan for this SQL when the problem occurred is as follows:
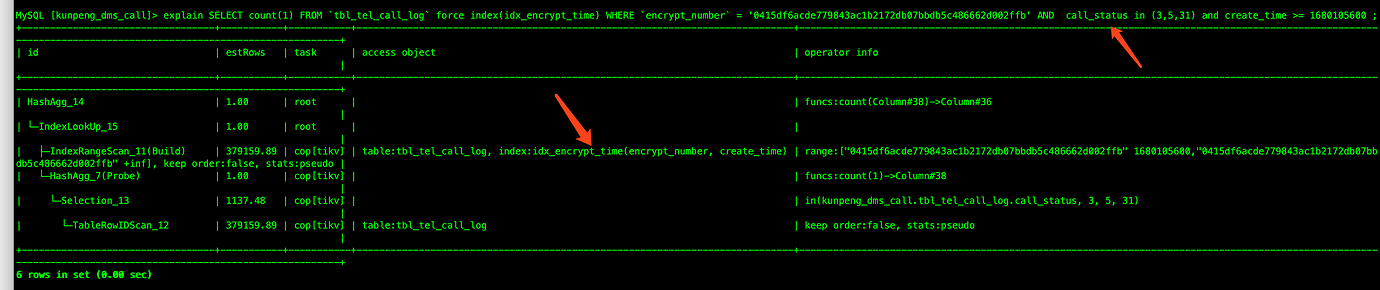
The correct index used: KEY
idx_encrypt_time (encrypt_number,create_time)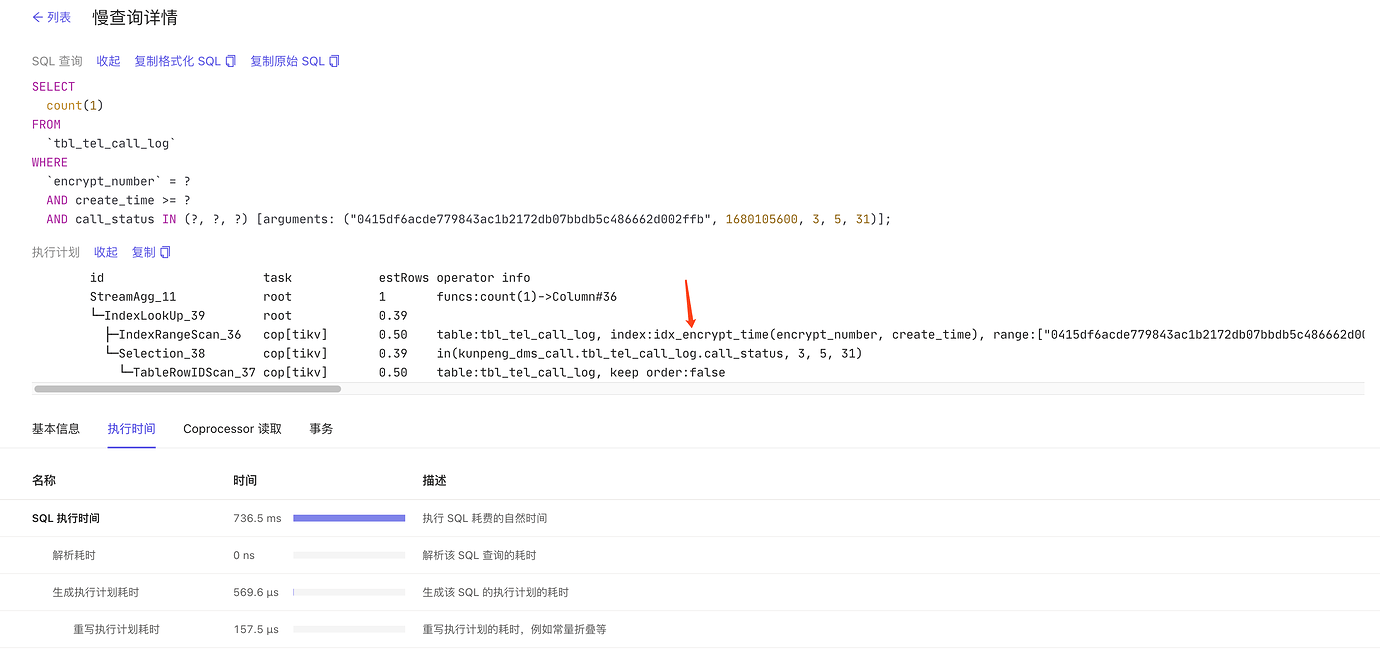
Question 1: This SQL has been running for a long time. Why did the execution plan suddenly change to use the call_status index?
Question 2: When I tried to reproduce it locally, even using force index did not use the correct index. Why is that?
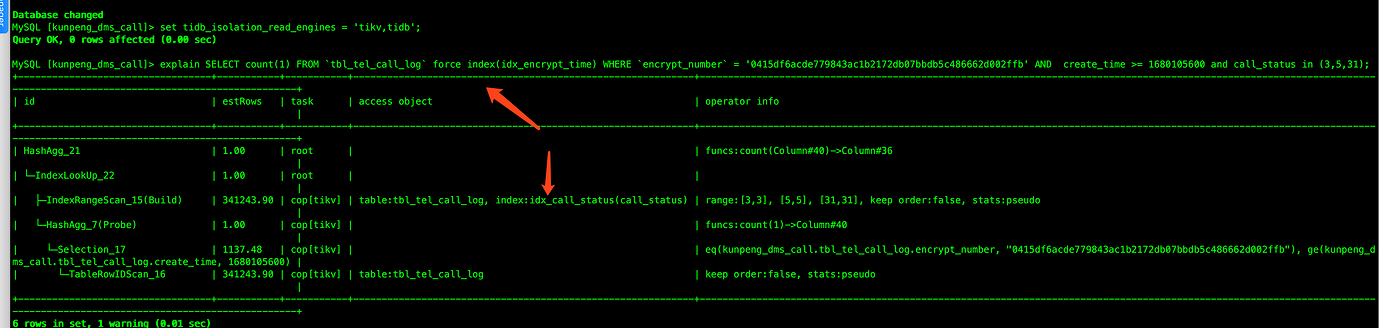
When I adjusted the position of call_status in the WHERE clause, the execution plan became normal. What is the reason for this?