Note:
This topic has been translated from a Chinese forum by GPT and might contain errors.
Original topic: SQL执行耗时异常
[TiDB Usage Environment] Production Environment
[TiDB Version] v6.5.2
[Reproduction Path] Operations performed that led to the issue
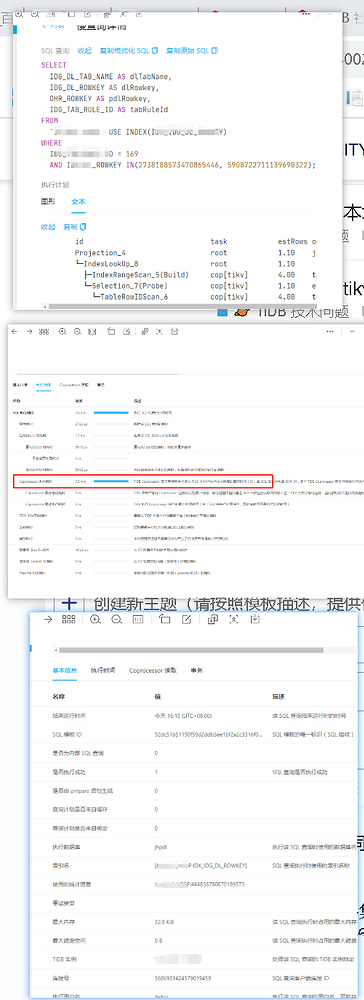
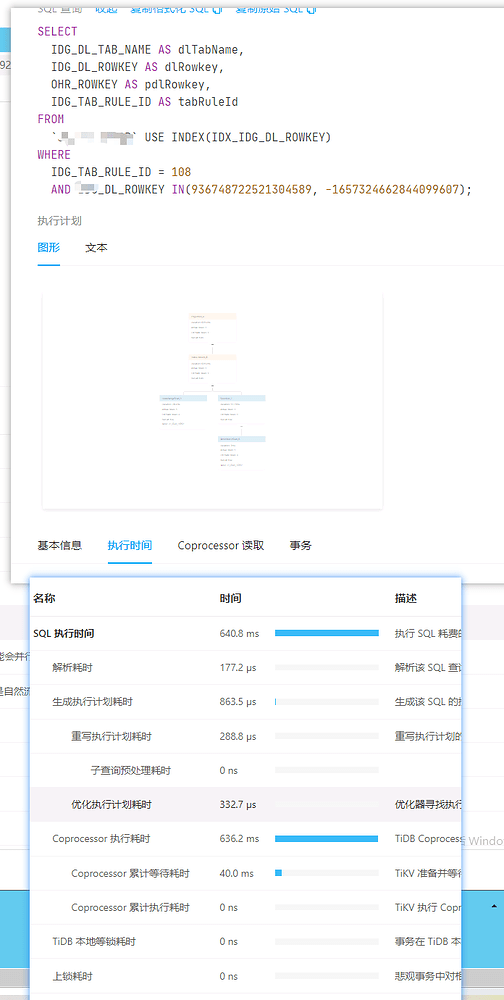
[Encountered Issue: Problem Phenomenon and Impact] The execution time of the same type of SQL varies greatly, sometimes taking a few hundred milliseconds and sometimes a few minutes. An example is shown in the image below.
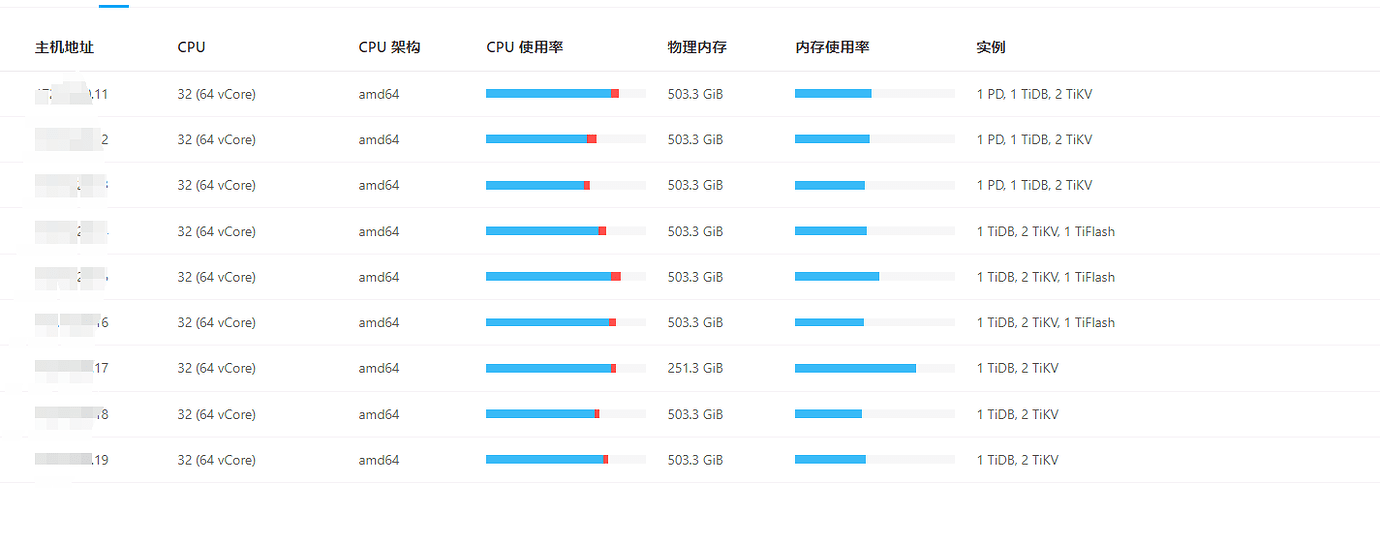
[Resource Configuration] Go to TiDB Dashboard - Cluster Info - Hosts and take a screenshot of this page
[Attachments: Screenshots/Logs/Monitoring]
Try executing the two SQL statements manually on the client. Is there a significant difference in speed?
How do you determine the same type of SQL?
We have encountered this as well. Manual execution should be very fast. This is influenced by the actual execution of other SQL in the environment. What can be done is to optimize this statement as much as possible.
The same type, but different query conditions, right? Could it be because querying one day’s data versus one year’s data is causing the difference?
It’s the same SQL with different conditions.
The query conditions are all primary keys.
This depends on the execution plan. You need to manually execute it with different conditions to see. It seems that the two execution plans might differ significantly, and the amount of data scanned under different conditions could vary greatly.
It seems that the optimization for joins is not very reliable with cost model 2. I used STRAIGHT_JOIN to replace JOIN, and the SQL execution performance improved significantly. I also tried using cost model 1, and the SQL execution efficiency was better than with cost model 2.
It would be best to send the complete execution plan. The information in the screenshot is not very comprehensive, and some information is not visible.
This topic was automatically closed 60 days after the last reply. New replies are no longer allowed.