Note:
This topic has been translated from a Chinese forum by GPT and might contain errors.
Original topic: TICDC 监控指标异常
Database version: 5.0.4
-
CDC metrics:
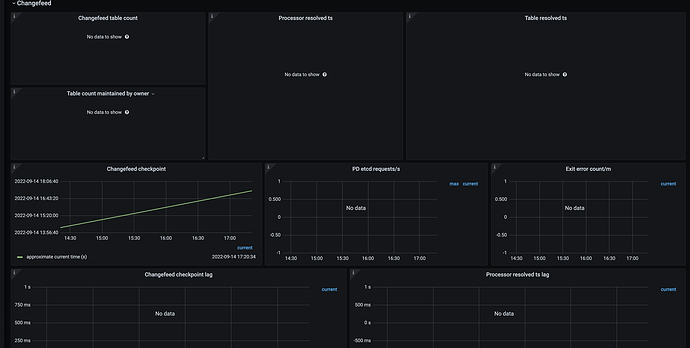
curl -i http://cdcip:8300/metrics shows data, but there is none on the dashboard.
Deployment method: Scale TiDB/TiKV/PD/TiCDC nodes
-
reload -R=prometheus,grafana dashboard still has no monitoring data.
Additionally, the monitoring dashboard shows a lot of NoDATA issues:
The phenomenon is very similar to this post: TiCDC监控看板没有监控数据 - TiDB 的问答社区, followed the post’s operations, but no recovery.
Did you create a changefeed? If not, many panels under the changefeed panel will be missing because no changefeed replication has been created.
Created before, now there are 5 or 6 changefeeds.
Troubleshooting steps:
- Since there are metrics, check if they are in Prometheus.
- If not, check the Prometheus logs for clues, such as the port not being exposed or the configuration not being included in Prometheus at all.
- If they are present, then check if the expression in Grafana is correct.
Follow these steps one by one, and you will find the answer.
Will reload restore according to the post?
It seems that prometheus didn’t go to ticdc to fetch data, persistence~
Reload Prometheus and Grafana again to restore.
This topic was automatically closed 60 days after the last reply. New replies are no longer allowed.


