Note:
This topic has been translated from a Chinese forum by GPT and might contain errors.
Original topic: tikv gc safepoint 异常
[TiDB Usage Environment] Production Environment / Testing / Poc
[TiDB Version]
[Reproduction Path] What operations were performed when the issue occurred
[Encountered Issue: Issue Phenomenon and Impact]
[Resource Configuration] Enter TiDB Dashboard - Cluster Info - Hosts and take a screenshot of this page
[Attachments: Screenshots/Logs/Monitoring]
Continuing from this issue BR备份报错cannot pass gc safe point check - TiDB 的问答社区
After upgrading to 7.1.1, some issues still persist. The problem remains even before changing tidb_gc_life_time and tidb_gc_run_interval:
It can be divided into three stages:
-
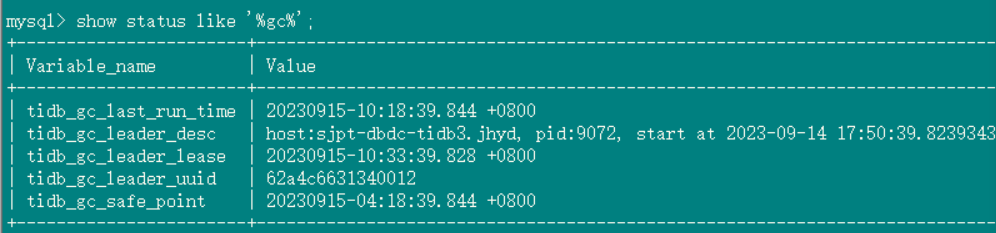
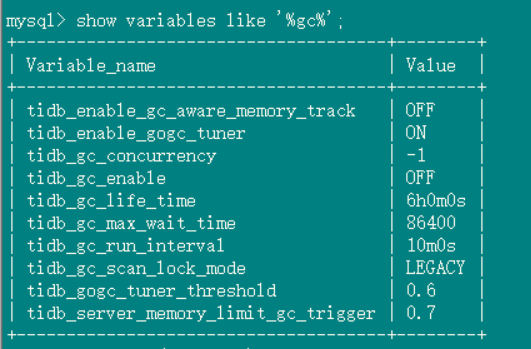
tidb_gc_life_time=6h0m0s, tidb_gc_run_interval=10m0s, and GC is turned off. The safepoint on Grafana is inconsistent with the one found in TiDB ---- same as in version 6.1.0;
GC status in the database:
GC settings:
-
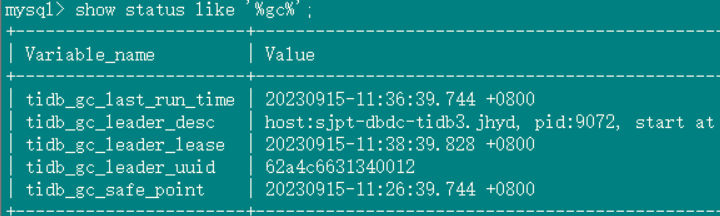
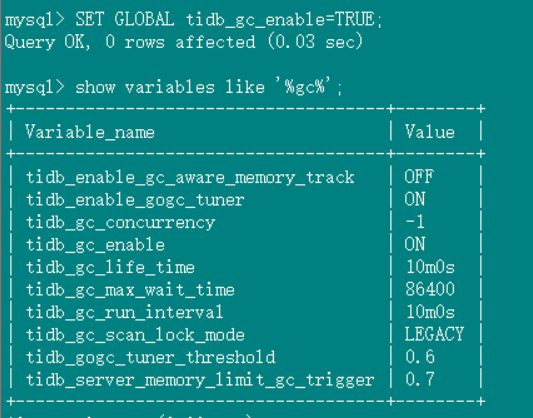
tidb_gc_life_time=10m0s, tidb_gc_run_interval=10m0s, GC is turned on, and the safepoint on Grafana quickly becomes consistent with the one found in TiDB.
GC status in the database:
GC settings:
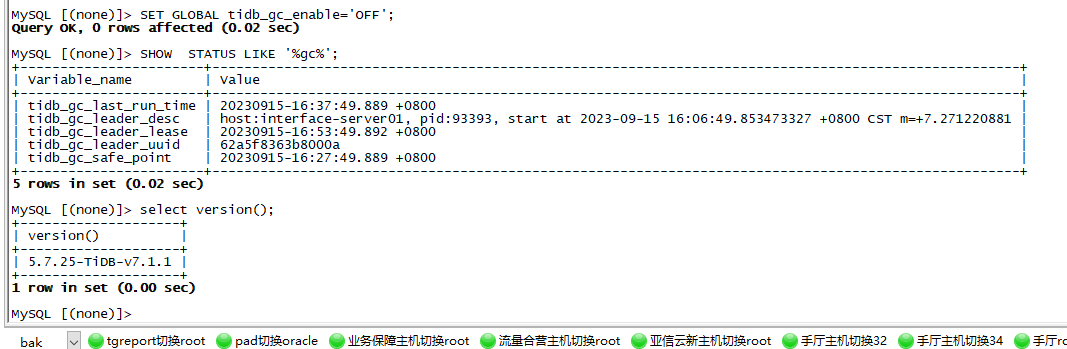
-
GC is turned off, and the safepoint on Grafana is consistent with the one found in TiDB, and the safepoint indeed stops.
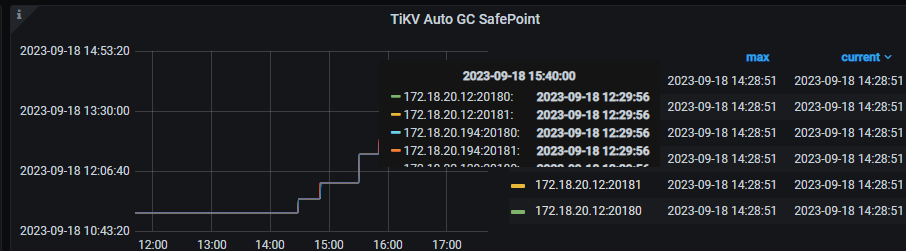
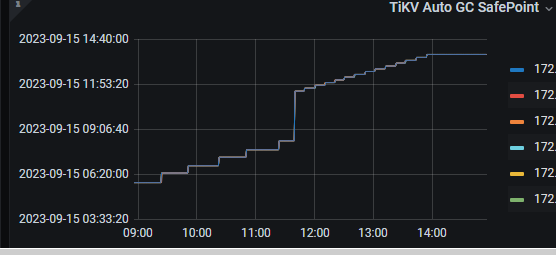
Grafana GC safepoint for the three stages:
What you mean is that after disabling the tidb_gc_enable parameter on version 7.1.1, the safepoint is no longer advancing when viewed from the TiDB client, but it is still advancing on Grafana?
That’s right, in TiDB it seems to correspond to the configured 6 hours, but Grafana is continuously advancing.
Can you reproduce the previous scenario of turning off GC and then advancing the safepoint in Grafana? I checked that the safepoint in Grafana is obtained from Prometheus monitoring. If you can reproduce it, try opening http://kvip:20180/metrics. In this monitoring data, there is a tikv_gcworker_autogc_safe_point. Check if this time is advancing. If tidb_gc_safe_point does not change while tikv_gcworker_autogc_safe_point in the monitoring continues to advance, then this is a bug.
However, I tested it and did not reproduce the issue. After disabling tidb_gc_enable, the savepoints on both sides did not advance.

At present, it is indeed impossible to reproduce, but if you look at the Grafana screenshot above, this situation did occur. Also, in my previous post, I mentioned that I upgraded from version 6.1.0 where this issue existed. I discovered this issue again this morning, and it returned to normal after modifying tidb_gc_life_time.
It should be affected by tidb_gc_life_time.
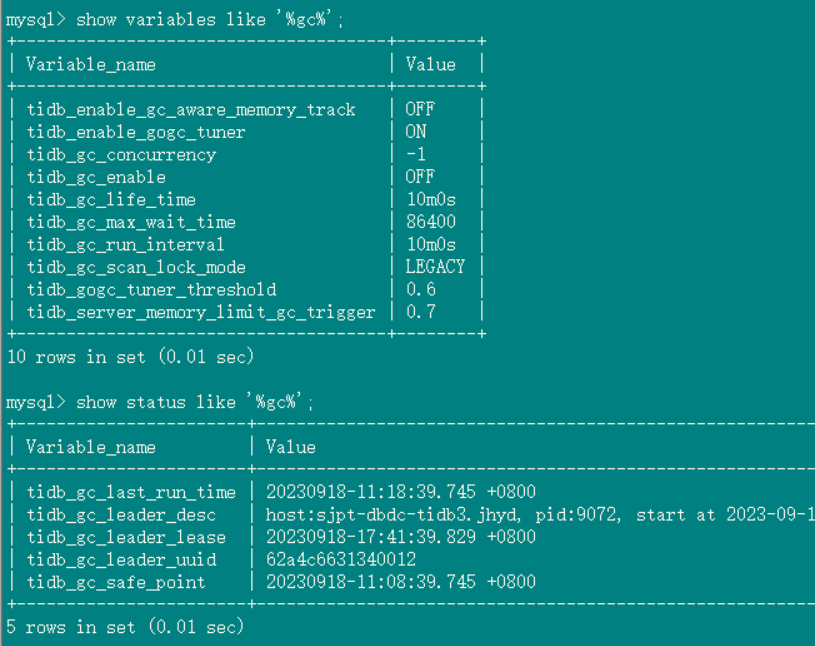
Reproduced,
GC was closed before 12:00
[2023/09/18 14:17:49.813 +08:00] executed BR, it seems that BR will start GC, and this start is not synchronized with TiDB, the BR process was terminated due to safepoint
BR command: tiup br backup full --pd “172.18.19.xxx:2379” --storage “s3://xx-bigdata-temp?access-key=xx-bigdata-temp&secret-access-key=xxxx&endpoint=
http://xxxx:8333&force-path-style=true” --ratelimit 128
I don’t know if other friends can reproduce this issue. If you had this problem in version 6.1, it is possible that it also affects version 7.1.1 due to the same issue!
The two safepoints will remain inconsistent. Turn on GC and continuously observe that both safepoints are advancing but remain inconsistent. Reset tidb_gc_life_time to another value and then change it back. Continue to observe and find that the frequency in Grafana is also 10 minutes, and the values are consistent with TiDB, but there is a delay in time (Grafana is slightly slower).
Could you please test in the environment to find a stable and minimal reproducible step? Thank you.
The gc safepoint queried by TiDB is not advancing, and CDC is also stuck at the same gc point as TiDB, while Grafana is still advancing. How can this be resolved?
As long as I turn off GC and use BR to back up for more than 3 hours, I can reproduce the issue (Grafana’s GC starts advancing on its own, TiDB remains unchanged, and the backup fails).
Command:
tiup br backup full --pd “172.18.19.xxx:2379” --storage “s3://xx-bigdata-temp?access-key=xx-bigdata-temp&secret-access-key=xxxx&endpoint=http://xxxx:8333&force-path-style=true” --ratelimit 128 --gcttl 54000
(Note: Adding --gcttl 54000 makes no difference)
The night before last, the same situation occurred. Yesterday morning, the GC returned to normal (both were consistent). Yesterday, I tried separate backups again (the overall backup always failed), but this morning it didn’t recover and got stuck at 1 o’clock.
Please post the execution plan for the reproduction path.
What actions do others need to take to encounter this issue?
Provide the entire minimal reproduction path in text form, detailing the specific steps without using images.
What does it mean that GC is turned off and the backup is successful?
Turn off GC, then execute BR backup. After about 3 hours and 20 minutes, the backup will exit due to a safepoint exception (Grafana’s GC safepoint was refreshed).
“[gc worker] failed to upload safe point to PD” [uuid=62a4c6631340012] [error="PD rejected our safe point 444416815790555142 but is using another safe point 444420412640329728
The gc safepoint is inconsistent in three places.
Found the reason, it was stuck by TiCDC’s safepoint.