Note:
This topic has been translated from a Chinese forum by GPT and might contain errors.
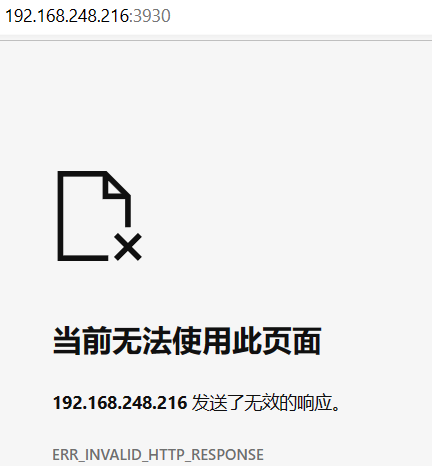
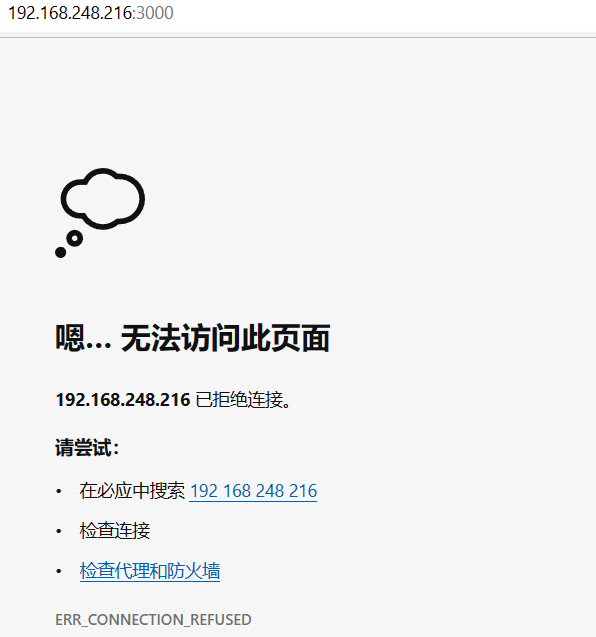
Original topic: 单机环境下,访问Grafana 监控被拒绝,可以访问Dashboard
[TiDB Usage Environment] Single machine environment
[TiDB Version] v6.1.2
[Reproduction Path] Follow the official documentation for quick start to simulate deployment of a production environment cluster on a single machine
[Encountered Problem: After installation, access to Grafana monitoring is denied, firewall etc. have been turned off]
[Resource Configuration] Go to TiDB Dashboard - Cluster Info - Hosts and take a screenshot of this page
[Attachment: Screenshot/Log/Monitoring]


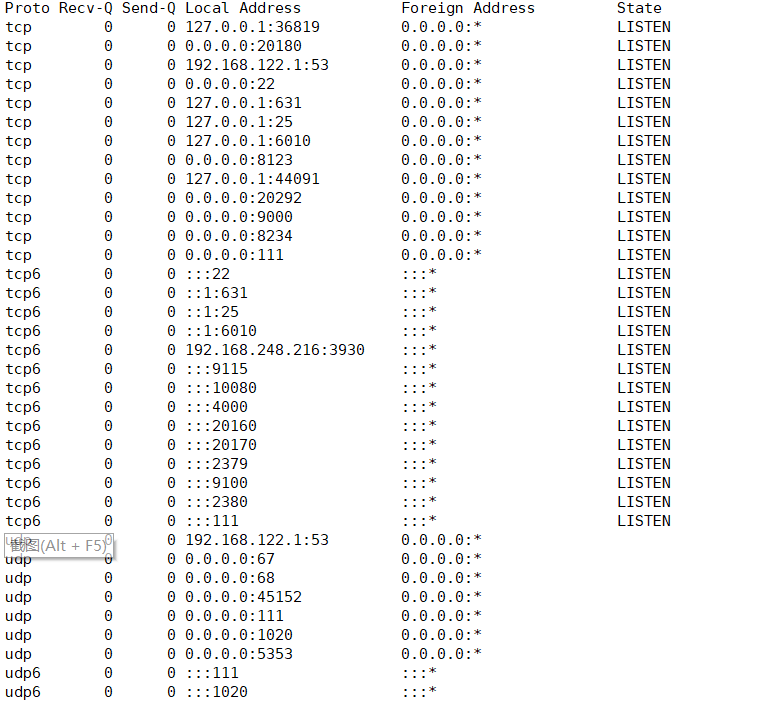
Has the port 3000 come up with netstat -anp | grep 3000?
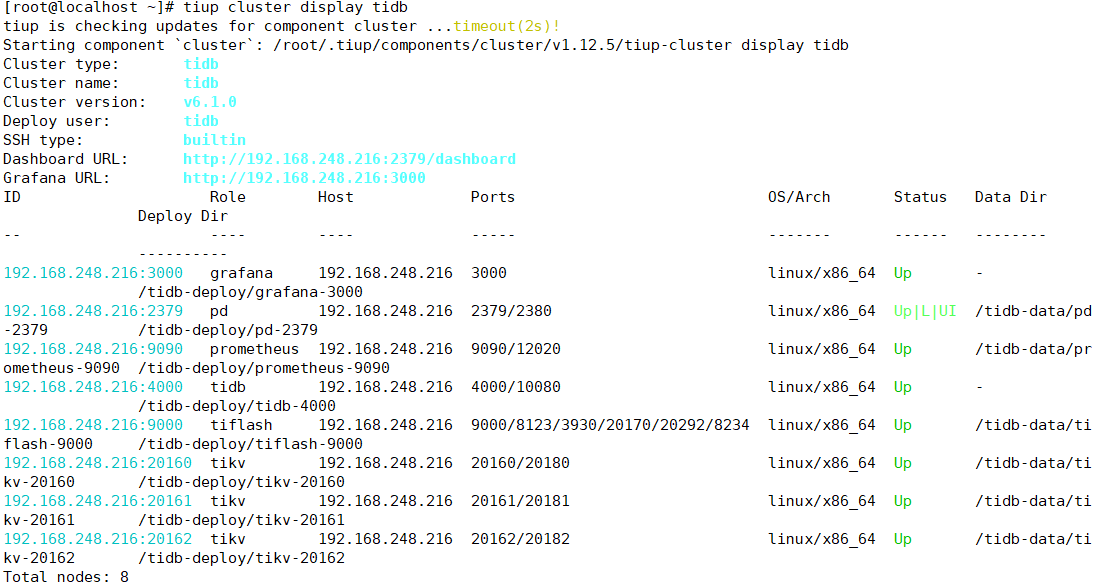
Check if the Grafana node has come up with tiup cluster display <tidb-cluster-name>.
I tested it, and there was no return result. It should not be running.
From your screenshot, there doesn’t seem to be any monitoring information. Could it be that monitoring hasn’t been deployed? Check if it’s included in your topology.
Stupid, it seems that monitoring was not deployed.
It looks like you haven’t deployed the alertServer and Grafana services.
Thank you for the guidance. I checked the official documentation, and it does not mention the need for manual deployment.
Thank you for the guidance. I checked the official documentation, and there is no manual deployment. Now I know, thank you, thank you.
Obviously, it hasn’t started. tiup cluster display will show the status.
Got it, it was my mistake. I didn’t deploy it manually. I thought it was automatic deployment after reading the official documentation.
Correcting the mistake, I tried again today. I don’t know if it’s because I used
tiup cluster check ./topology.yaml --apply --user root -p
After reinstalling, the cluster status verification was successful.
This topic was automatically closed 60 days after the last reply. New replies are no longer allowed.
![]()
