Note:
This topic has been translated from a Chinese forum by GPT and might contain errors.
Original topic: tidb下午挂掉一个pd,修复后,现在发现br备份非常慢
[TiDB Usage Environment] Production Environment
[TiDB Version] 5.4.2
[Reproduction Path] Operations performed that led to the issue
[Encountered Issue: Problem Phenomenon and Impact]
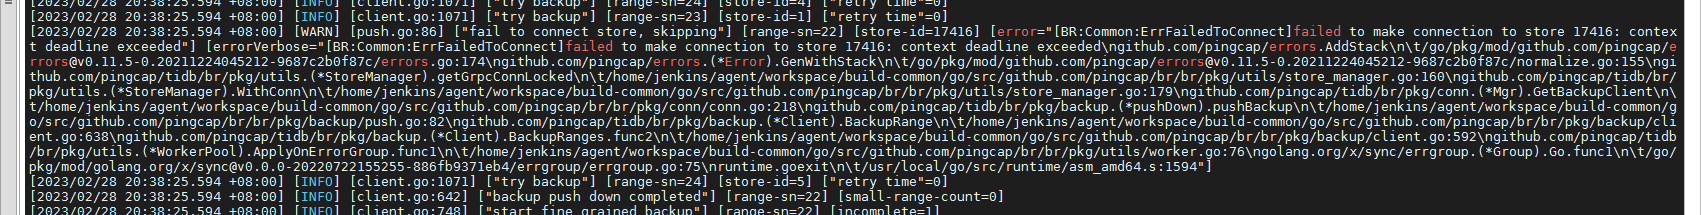
A PD node in TiDB went down in the afternoon. After fixing it, we now find that BR backup is extremely slow. It takes almost 30 minutes to back up just 1% of a few dozen GBs of data, which is much slower than before. Restarting the cluster did not improve the situation. The resources on the servers of several nodes are normal. Not sure if the WARN log of BR has any issues.
[Resource Configuration]
[Attachments: Screenshots/Logs/Monitoring]
Latest Supplement:
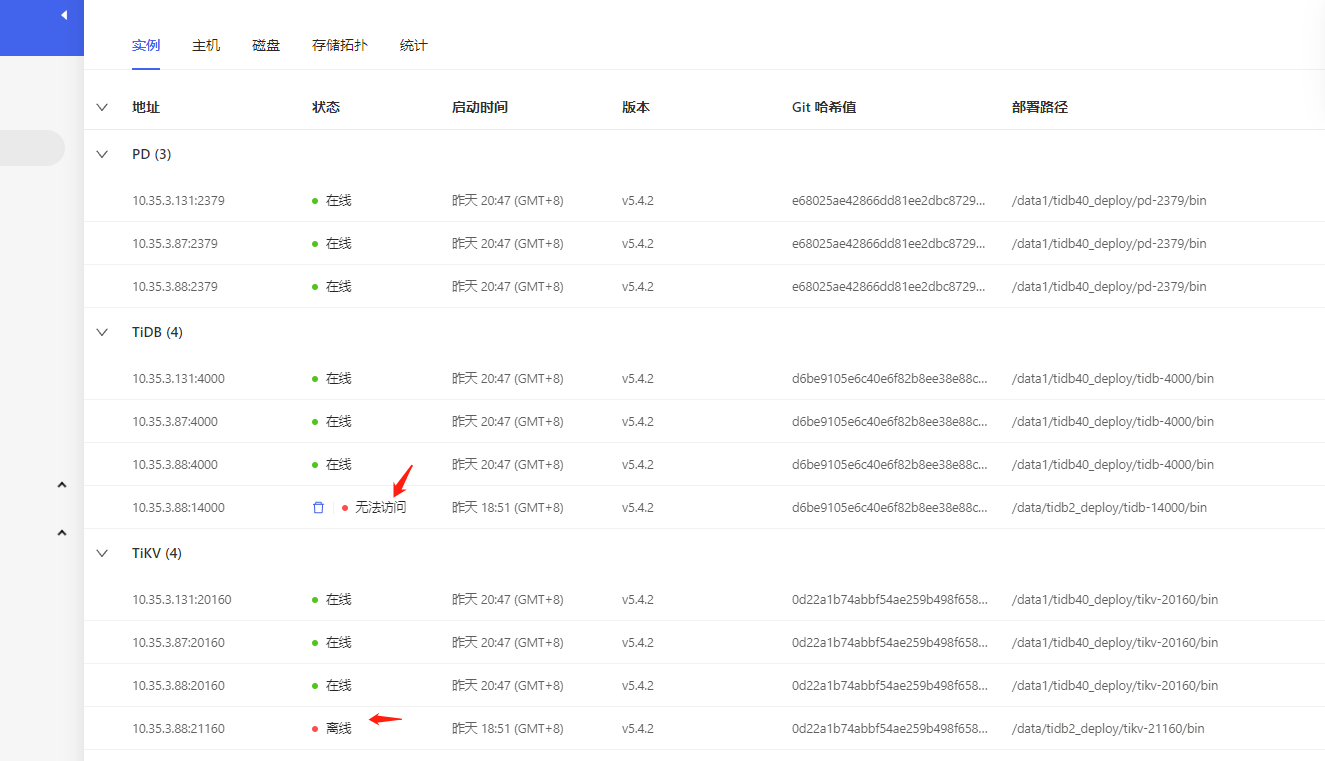
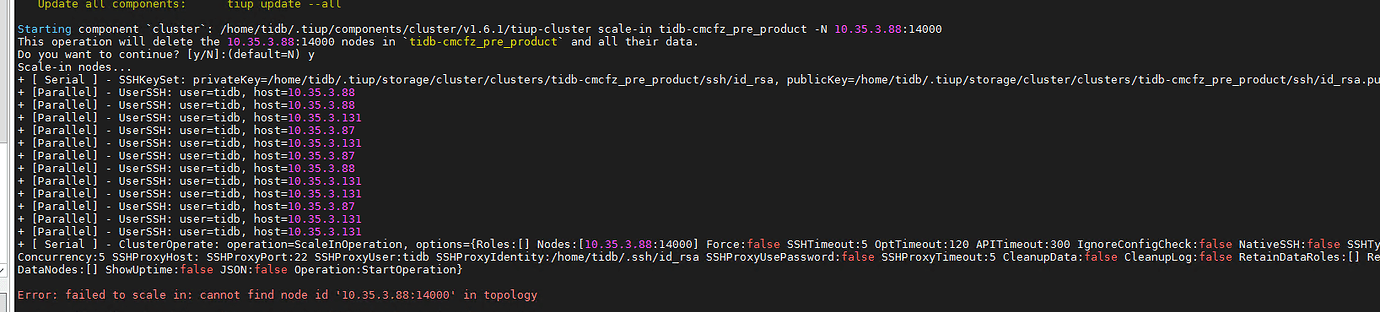
These two offline nodes belong to another cluster. At that time, a single-node TiDB was set up on 3.88 for testing, and later it was removed. However, TiDB 10.35.3.88:14000 and TiKV 10.35.3.88:21160 are still showing up here, but they are not visible through tiup cluster display. They cannot be removed using the scale-in command:
Check which TiKV node instance Store 17416 belongs to.
It would be best to use Grafana to see if the various metrics of the cluster are normal.
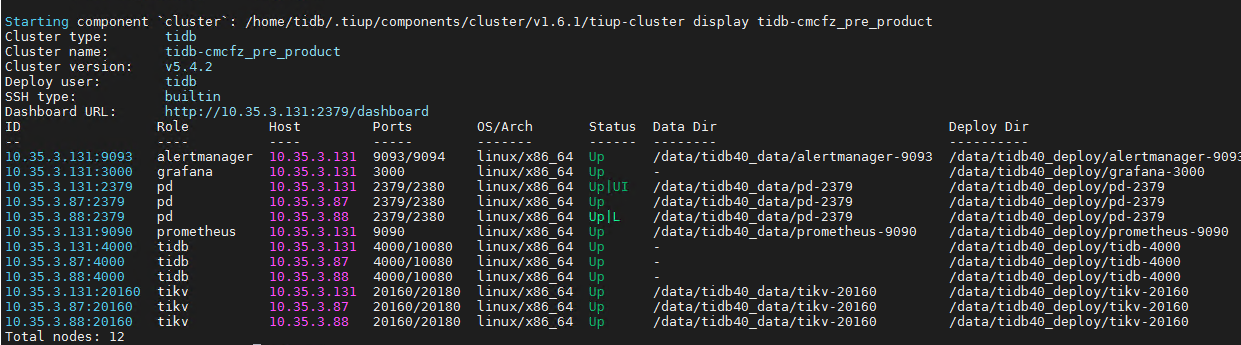
This store is at 3.88:21160, not in my cluster. My cluster’s TiKV only has:
3.131:20160
3.87:20160
3.88:20160
This 3.88:21160 was a temporary test on 3.88, a single-node TiDB cluster, which has already been removed.
This TiKV store hasn’t been properly cleared.
Stop messing around in production, prioritize addressing the environmental issues…
I can’t see those two strange nodes on the display. I just saw you mention monitoring, so I went to check and found out.
Thank you, I will take a look at the document you sent~
However, they are not in the current cluster list. How can I delete those 2 problematic nodes? 
How did you handle the offline of these two nodes before?
Try using tiup’s cleanup capability.
The cluster you tested should also be using the production PD. First, refer to the following to clean up the invisible TiKV. The normal TiKV and the abnormal TiKV on 3.88 have the same port and IP, which may affect the operation.
You can try adding the 14000 TiDB server in .tiup/storage/cluster/clusters/{cluster-name}/meta.yaml and then try scaling in.
Those two nodes were a temporary single-node TiDB deployed on 3.88, for example, cluster B, used for testing. I later destroyed the entire setup. However, through monitoring, I found that those two nodes were still left in the production cluster A.
Production and testing use the same subnet.
If the data volume is small, I recommend using Dumpling.
Okay, I will study this document first, thank you.
This topic was automatically closed 60 days after the last reply. New replies are no longer allowed.