Note:
This topic has been translated from a Chinese forum by GPT and might contain errors.
Original topic: tidbV7.1.2安装部署完成后打开dashboard,出现概况和监控指标都出现failed to send requests to Prometheus
[TiDB Usage Environment] Production Environment / Testing / Poc
[TiDB Version]
[Reproduction Path] What operations were performed when the issue occurred
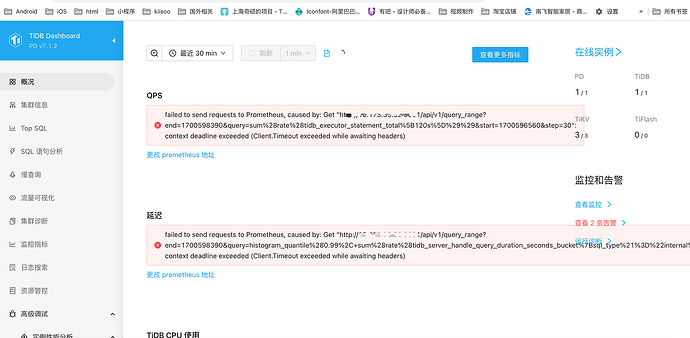
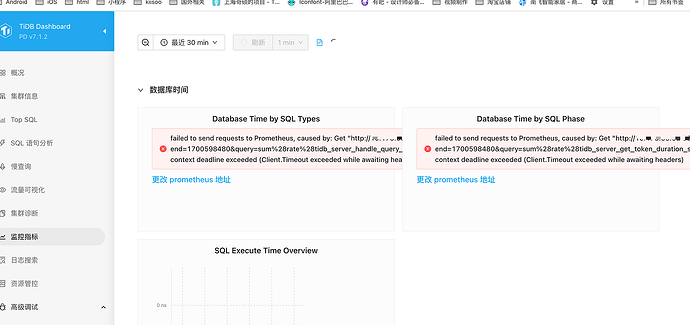
After the installation and deployment are completed, the first time logging into the dashboard, the following issue appears
[Encountered Issue: Issue Phenomenon and Impact]
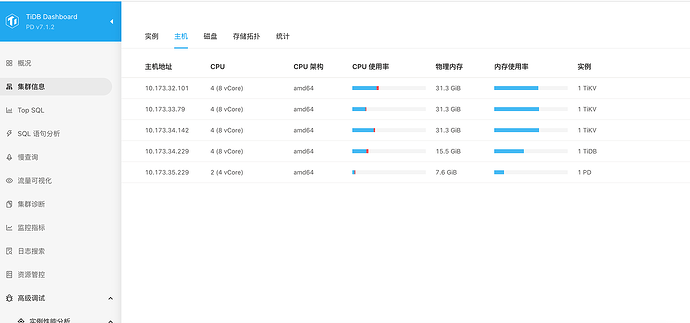
[Resource Configuration] Go to TiDB Dashboard - Cluster Info - Hosts and take a screenshot of this page
[Attachments: Screenshots/Logs/Monitoring]
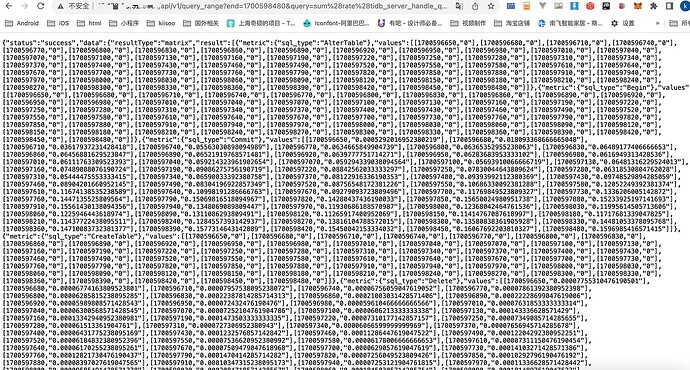
According to the path that appears, it is accessible
Can the PD node where the dashboard is located access this address?
From the error, it appears to be caused by a connection timeout. Please check the connectivity between the two machines.
Change the PROMETHEUS address and check the configuration file.
It’s best to take a screenshot of your cluster topology configuration file. There might be an issue with your configuration.
Check with tiup cluster display.
I just tried accessing the address and it timed out, but the IPs of the two machines are interconnected. What’s going on?
The image is not available for translation. Please provide the text content for translation.
Clicking update redirected me here.
First, try telnetting the port. Maybe the firewall is enabled…
Ping works, does telnet work?
Is it working properly after the jump?
There isn’t much of an issue, but it feels like the deployment directory, data directory, and log directory are a bit redundant because your paths are all under /data/tidb-deploy and /data/tidb-data directories. Since you have already configured the global settings, you can omit them for each node. Additionally, the arch configuration in the global settings doesn’t seem very meaningful. Are you sure your architecture is amd64 or x86?
Try connecting with shell to see if you can access the machine?
Test it with curl, and then check if the port is accessible.
It feels like the network is disconnected, and the Prometheus service cannot be accessed.
The firewall is already turned off…

Not working, even with the firewall turned off.


