After Deleting a Large Amount of Data from the Table, Using Limit 1 Without Any Conditions is Very Slow

Note:
This topic has been translated from a Chinese forum by GPT and might contain errors.

Original topic: 表大批量删除数据后 使用不带任何条件的limit1非常慢

| username: zzw6776

The background is a table with about 1.3 billion records. Approximately 1 billion records were deleted using non-transactional DML, leaving around 200 million records.

Now, executing select * from xxx limit 1 takes more than 3 minutes to return a result. However, using an index in the WHERE clause for queries works normally.

Execution plan:

Limit_7	1.00	1	root		time:3m24.4s, loops:2	offset:0, count:1	N/A	N/A
└─IndexReader_14	1.00	1	root		time:3m24.4s, loops:1, cop_task: {num: 1829, max: 402.8ms, min: 134.9µs, avg: 111.7ms, p95: 246.4ms, max_proc_keys: 1, p95_proc_keys: 0, tot_proc: 3m22.7s, tot_wait: 42ms, rpc_num: 1829, rpc_time: 3m24.3s, copr_cache_hit_ratio: 0.46, distsql_concurrency: 1}	index:Limit_13	326 Bytes	N/A
  └─Limit_13	1.00	1	cop[tikv]		tikv_task:{proc max:472ms, min:33ms, avg: 186.8ms, p80:229ms, p95:280ms, iters:1829, tasks:1829}, scan_detail: {total_process_keys: 1, total_process_keys_size: 46, total_keys: 851728674, get_snapshot_time: 283.7ms, rocksdb: {delete_skipped_count: 19440216, key_skipped_count: 871167911, block: {cache_hit_count: 11891, read_count: 554620, read_byte: 5.93 GB, read_time: 2.09s}}}	offset:0, count:1	N/A	N/A
    └─IndexFullScan_11	1.00	1	cop[tikv]	table:h_equip_bin_box_status_history, index:idx_gmt_create(gmt_create)	tikv_task:{proc max:472ms, min:33ms, avg: 186.8ms, p80:229ms, p95:280ms, iters:1829, tasks:1829}	keep order:false	N/A	N/A
| username: h5n1 | Original post link

It’s still an MVCC issue. Wait for GC to clean up or manually compact.

| username: zhanggame1 | Original post link

Rebuild the table and migrate the data.

| username: TiDBer_vfJBUcxl | Original post link

After deleting a large amount of data, many useless keys will remain, affecting query efficiency. To solve this problem, you can try enabling the Region Merge feature. For details, refer to the data deletion section in the Best Practices.

| username: zhanggame1 | Original post link

Actually, it doesn’t work. Merging is not possible. Clearing the table data won’t reduce the region size to meet the merge conditions.

| username: tidb菜鸟一只 | Original post link

delete_skipped_count: 19440216, key_skipped_count: 871167911
The deleted data has not been truly garbage collected.
It is recommended to perform manual compaction during off-peak business hours.

| username: redgame | Original post link

Manual compact

| username: zzw6776 | Original post link

Manual compaction has no effect.
There are a total of 6 nodes, all of which have been executed.

But it seems that it has not been cleaned up.

Executing the query in the question is still very slow.

| username: tidb菜鸟一只 | Original post link

Please post the execution plan for select * from xxx limit 1. Is it still the same as before?

| username: h5n1 | Original post link

Did your execution finish very quickly? Add -c write -d kv

| username: zzw6776 | Original post link

It didn’t execute for 2 or 3 hours.

| username: h5n1 | Original post link

Refer to the following, only compact this table, add -c write -d kv

mysql -uroot -pXXX -hxxx -PXXX  information_schema -e "select region_id from tikv_region_status where db_name='oltp' and table_name='sbtest8'" > region_list
cat region_list | while read line
do
   tiup ctl:v7.1.0 tikv --host xxxx:20160 compact -r $line -d kv -c write --threads 1 --bottommost force
   tiup ctl:v7.1.0 tikv --host xxx:20160 compact -r $line -d kv -c default --threads 1 --bottommost force
done
| username: zzw6776 | Original post link

Limit 1 has become faster, but it seems to be due to caching. Limit 100 is still very slow.

Limit_7  1.00  1  root  time:2.1s, loops:2  offset:0, count:1  N/A  N/A
└─TableReader_11  1.00  1  root  time:2.1s, loops:1, cop_task: {num: 1445, max: 283ms, min: 181µs, avg: 1.42ms, p95: 1.92ms, max_proc_keys: 1, p95_proc_keys: 0, tot_proc: 995ms, tot_wait: 151ms, rpc_num: 1445, rpc_time: 2.04s, copr_cache_hit_ratio: 1.00, distsql_concurrency: 1}  data:Limit_10  540 Bytes  N/A
  └─Limit_10  1.00  1  cop[tikv]  tikv_task:{proc max:752ms, min:0s, avg: 376.1ms, p80:483ms, p95:552ms, iters:1445, tasks:1445}, scan_detail: {total_process_keys: 1, total_process_keys_size: 152, total_keys: 4129043, get_snapshot_time: 547.2ms, rocksdb: {delete_skipped_count: 270700, key_skipped_count: 4399736, block: {cache_hit_count: 6387, read_count: 1, read_byte: 64.0 KB, read_time: 64.7µs}}}  offset:0, count:1  N/A  N/A
    └─TableFullScan_9  1.00  1  cop[tikv]  table:h_equip_bin_box_status_history  tikv_task:{proc max:752ms, min:0s, avg: 376.1ms, p80:483ms, p95:552ms, iters:1445, tasks:1445}  keep order:false  N/A  N/A
| username: h5n1 | Original post link

How long is the GC time? Currently, only 270,000 keys are post-GC, and a total of 4.39 million need to be scanned.

| username: zzw6776 | Original post link

Before compacting a single table, I executed it without any effect, so I did a global compact. Now, I’m executing it with the -c write option, and it’s much slower… It needs to be executed more than 20,000 times in total. Some are waiting. I’ll check again after it’s done executing.

SELECT concat( 'tiup ctl:v6.5.1 tikv --host ',ADDRESS,' compact -d kv -c write --threads 1 --bottommost force -r ',a),APPROXIMATE_SIZE from ( 
SELECT DISTINCT(trs.REGION_ID) as a,ADDRESS,APPROXIMATE_SIZE from TIKV_REGION_STATUS trs left join  TIKV_REGION_PEERS trp on trs.REGION_ID = trp.REGION_ID LEFT JOIN TIKV_STORE_STATUS tss  on tss.STORE_ID =trp.STORE_ID  where table_name = 

'h_equip_bin_box_status_history'  ORDER BY APPROXIMATE_SIZE desc) as tmp;

The GC time hasn’t changed, it’s the default 10 minutes. What do the 270,000 and 4,390,000 represent here? Does it mean that to query one record, I need to scan 4,390,000 records, of which 270,000 are deleted but not yet compacted? Then what are the remaining (4,390,000 - 270,000) records?

Additionally, what does -c write represent? I couldn’t find any documentation about this.

| username: h5n1 | Original post link

You can check this: explain analyze 中的total_keys和key_skipped_count 的疑问? - #5,来自 Raymond - TiDB 的问答社区

In RocksDB, there are two CFs: default/write. The majority of data is in this CF.

| username: tidb菜鸟一只 | Original post link

delete_skipped_count: 270700, key_skipped_count: 4399736
delete_skipped_count has deleted about 270,000 entries that were not garbage collected.
key_skipped_count has marked about 4.39 million entries for garbage collection but they need to be compacted to be cleared.
So, compaction is still necessary.
Try running the following command to compact the write CF:
tiup ctl:v6.5.1 tikv --host ip:port compact -c write --bottommost force

| username: zzw6776 | Original post link

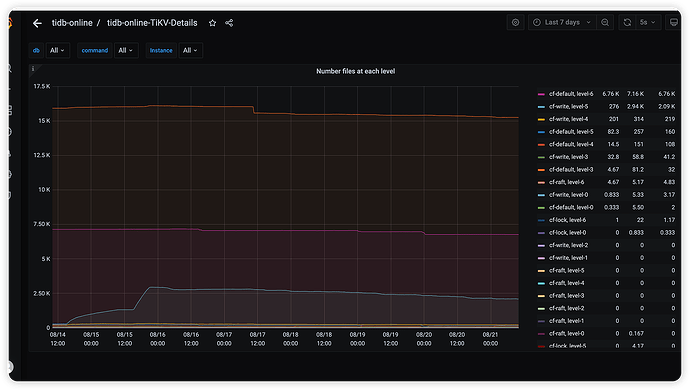
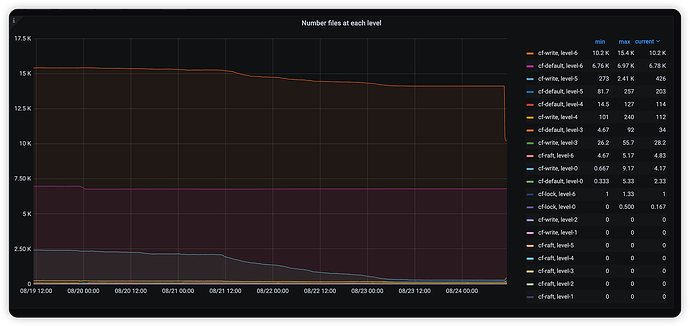
Thank you all for your answers.

It took 4 days to compact… finally finished compacting.

The execution plan is also correct.

Limit_7	100.00	100	root		time:1.86ms, loops:2	offset:0, count:100	N/A	N/A
└─TableReader_11	100.00	100	root		time:1.85ms, loops:1, cop_task: {num: 3, max: 761.3µs, min: 476.1µs, avg: 575.4µs, p95: 761.3µs, max_proc_keys: 100, p95_proc_keys: 100, rpc_num: 3, rpc_time: 1.7ms, copr_cache_hit_ratio: 0.33, distsql_concurrency: 1}	data:Limit_10	14.5 KB	N/A
  └─Limit_10	100.00	100	cop[tikv]		tikv_task:{proc max:121ms, min:0s, avg: 40.3ms, p80:121ms, p95:121ms, iters:5, tasks:3}, scan_detail: {total_process_keys: 100, total_process_keys_size: 15234, total_keys: 102, get_snapshot_time: 87.6µs, rocksdb: {key_skipped_count: 100, block: {cache_hit_count: 24}}}	offset:0, count:100	N/A	N/A
    └─TableFullScan_9	100.00	100	cop[tikv]	table:h_equip_bin_box_status_history	tikv_task:{proc max:121ms, min:0s, avg: 40.3ms, p80:121ms, p95:121ms, iters:5, tasks:3}	keep order:false	N/A	N/A
| username: cy6301567 | Original post link

Didn’t the underlying layer do partitioning? After partitioning, deletion is very fast. Also, I think doing a migration and then truncating might be better.

| username: system | Original post link

This topic was automatically closed 60 days after the last reply. New replies are no longer allowed.