Note:
This topic has been translated from a Chinese forum by GPT and might contain errors.
Original topic: 使用playground部署了单机的tidb集群后,无法访问dashboard,确认防火墙的端口已放开。
【TiDB Environment】Testing/, CentOS 7.9
【TiDB Version】7.4.0
【Reproduction Path】What operations were performed that led to the issue
【Encountered Issue: Issue Phenomenon and Impact】
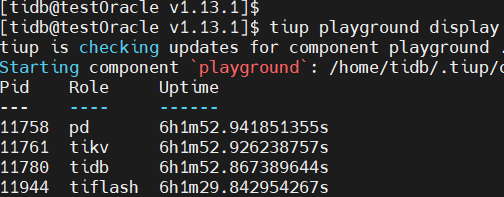
【Resource Configuration】
【Attachments: Screenshots/Logs/Monitoring】
There’s no need to use the playground; deploying on a single machine has fewer issues.
TiDB Quick Start Guide | PingCAP Documentation Center
Thanks, I just tried deploying without using the playground, and it was successful. However, opening the dashboard gives a 404 error, but Grafana can be opened.
Check with tiup display, then look into the PD logs to see which URL is returning a 404.
Awkward, I didn’t enter the full address. I missed “/dashboard” at the end. Now I can access it.
It’s normal when you first start, you’ll get used to it. Remember to mark the best answer 
Glad to hear it’s resolved. Feel free to visit often.
I heard you’re interested in the Dashboard, you can also check out the column.