Note:
This topic has been translated from a Chinese forum by GPT and might contain errors.Original topic: tikv单机多实例部署以后,发现经常会出现oom
Deployment details are as follows:
A total of 6 servers
3 servers deploy TiDB and PD, each with 3 instances
3 servers deploy TiKV (3 instances per server) and TiFlash (1 instance per server), totaling 9 TiKV and 3 TiFlash
Server configuration: Hygon G5 7285 (2.0GHz/32 cores/64MB/190W) ×2 + 512G memory
Using
dmesg -T | grep tidb-server or dmesg -T | grep oom
to check the kv servers, it can be seen that the kv service experiences OOM and restarts every 1 to 3 hours daily.
The tikv_stderr.log is empty.
The global storage.block-cache.capacity has been configured to half of 512G memory/4, which is 62GB.
Global configuration is as follows:
  tikv:
    readpool.storage.use-unified-pool: false
    readpool.coprocessor.use-unified-pool: true
    storage.block-cache.capacity: 62GB
    raftstore.apply-pool-size: 3
    raftstore.store-pool-size: 3
    server.grpc-concurrency: 8
Single TiKV configuration is as follows:
tikv_servers:
  - host: 192.168.1.64
    ssh_port: 22
    port: 20160
    status_port: 20180
    deploy_dir: "/data/1/tidb-deploy/tikv-20160"
    data_dir: "/data/1/tidb-data/tikv-20160"
    log_dir: "/data/1/tidb-deploy/tikv-20160/log"
    numa_node: "0"
    config:
      server.labels:
        host: tikv64
  - host: 192.168.1.64
    ssh_port: 22
    port: 20161
    status_port: 20181
    deploy_dir: "/data/2/tidb-deploy/tikv-20161"
    data_dir: "/data/2/tidb-data/tikv-20161"
    log_dir: "/data/2/tidb-deploy/tikv-20161/log"
    numa_node: "1"
    config:
      server.labels:
        host: tikv64
  - host: 192.168.1.64
    ssh_port: 22
    port: 20162
    status_port: 20182
    deploy_dir: "/data/3/tidb-deploy/tikv-20162"
    data_dir: "/data/3/tidb-data/tikv-20162"
    log_dir: "/data/3/tidb-deploy/tikv-20162/log"
    numa_node: "2"
    config:
      server.labels:
        host: tikv64
Grafana->TiKV-Detail->RocksDB-KV->Block Cache Size panel is as follows:
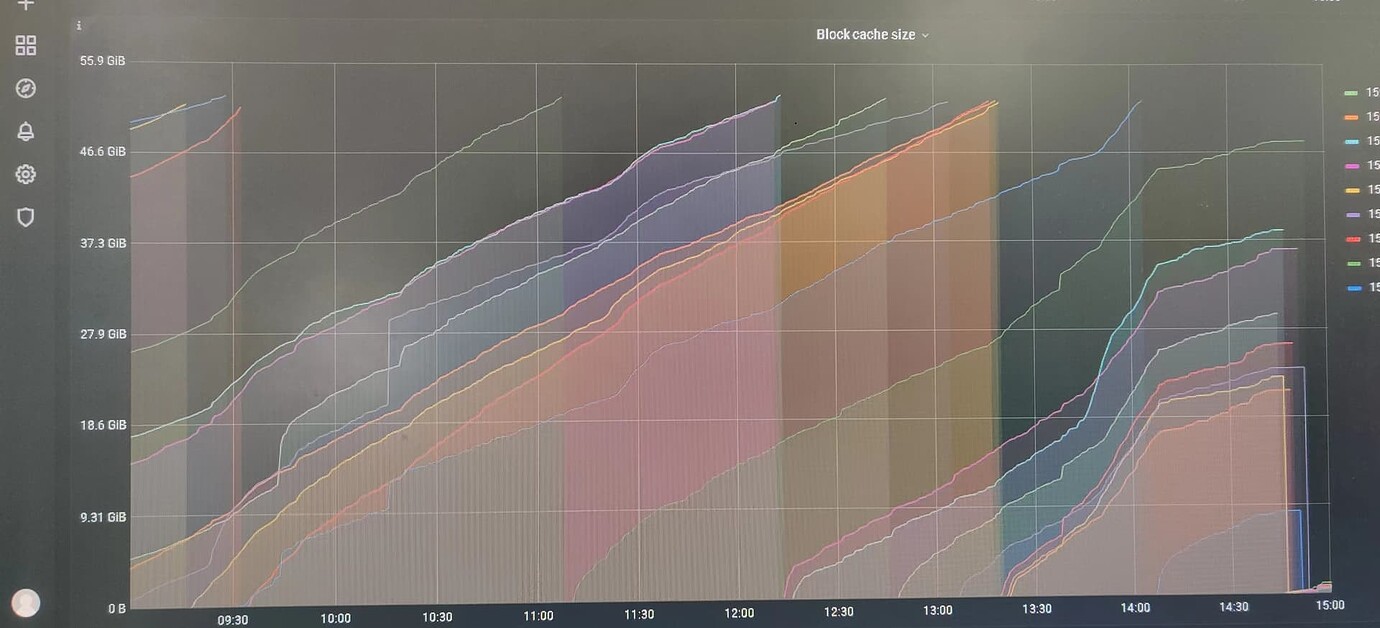
The max of each TiKV instance has not reached the set 62GB.