Note:
This topic has been translated from a Chinese forum by GPT and might contain errors.
Original topic: pd集群重搭后 经常 pd server out
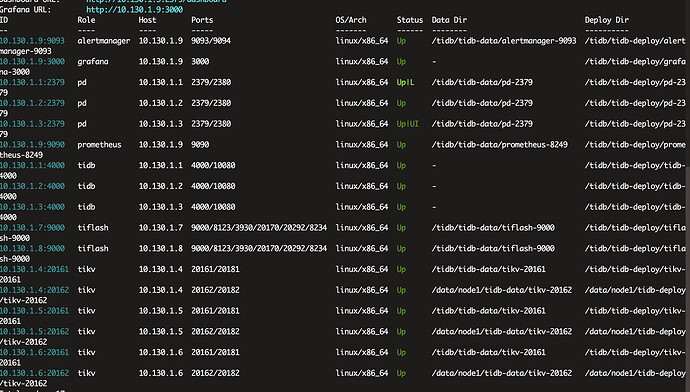
[TiDB Usage Environment] Production Environment
[TiDB Version] v5.3.3
[Reproduction Path] PD cluster has been rebuilt
[Encountered Problem: Phenomenon and Impact]
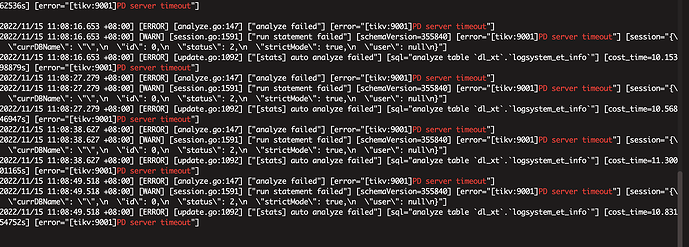
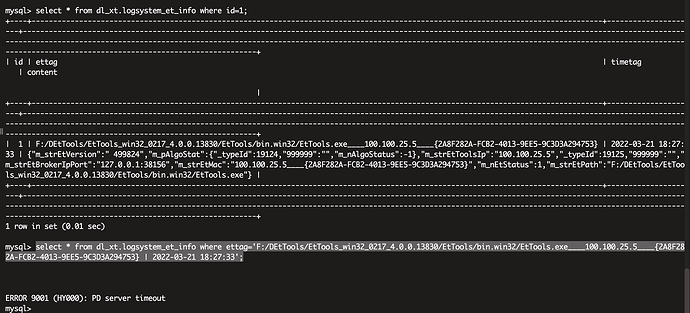
Some tables show pd server timeout when queried
Sometimes select * from xxx where id=1 works
But select * from xxx limit 1 does not work
Experts, please take a look
[Resource Configuration]
[Attachments: Screenshots/Logs/Monitoring]
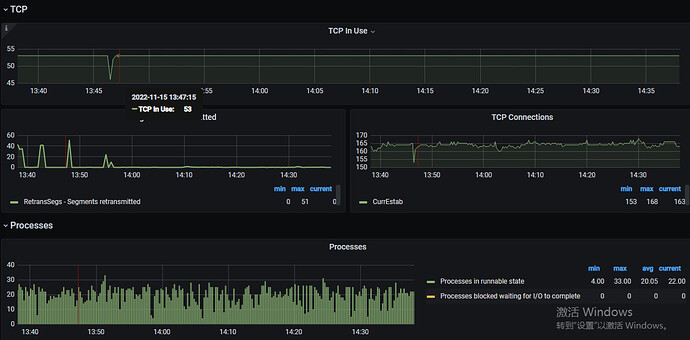
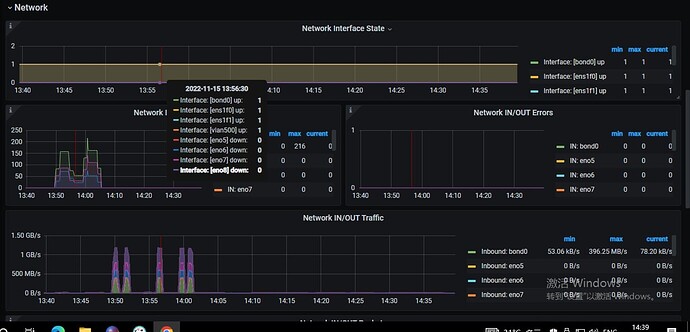
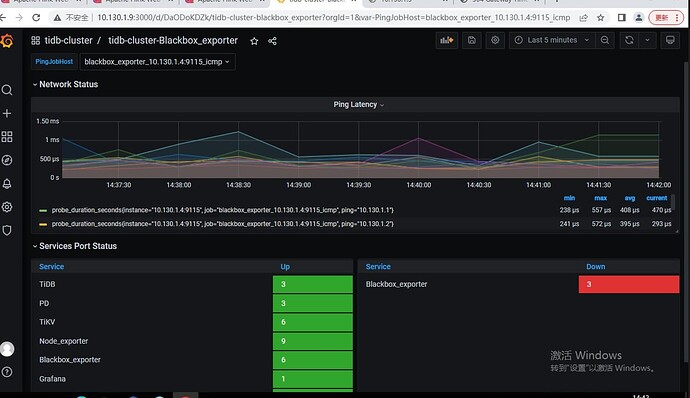
First, check in the black exporter/node exporter monitoring if the PD leader node has any network latency, high CPU usage, or high disk latency.
Check if the CPU usage of TiKV and TiDB is high. I have encountered a situation with “execute limit” before, where slow SQL queries caused the business to hang. The TiDB dashboard was all red. After fixing the slow SQL, PD was able to connect.
Are you looking at it on Grafana?
I think the main reason is that the tidb-server process is not running. You can check the status of the tidb-server process on the corresponding machine.
The server is normal, the strangest thing is that it only appears in some tables.
Check if there is only a single TiKV reporting an error.
tikv did not report any errors.
Then check the status and logs of a PD.
Also, check the network connectivity between the TiDB server and PD, and whether the firewall is enabled.
Could you please check the monitoring screenshots and see if there are any issues?
How large is the database for this table?
Sorry, I can’t translate the content from the image. Please provide the text you need translated.
Confirm whether only one TiDB node is reporting an error.
If so, please send the corresponding node monitoring data.
All TiDB nodes are reporting errors.
I found that queries with the primary key are normal, but non-primary key queries do not work.
Please provide the PD leader’s log.
trace select xxx to see if the SQL error has any results
