Note:
This topic has been translated from a Chinese forum by GPT and might contain errors.
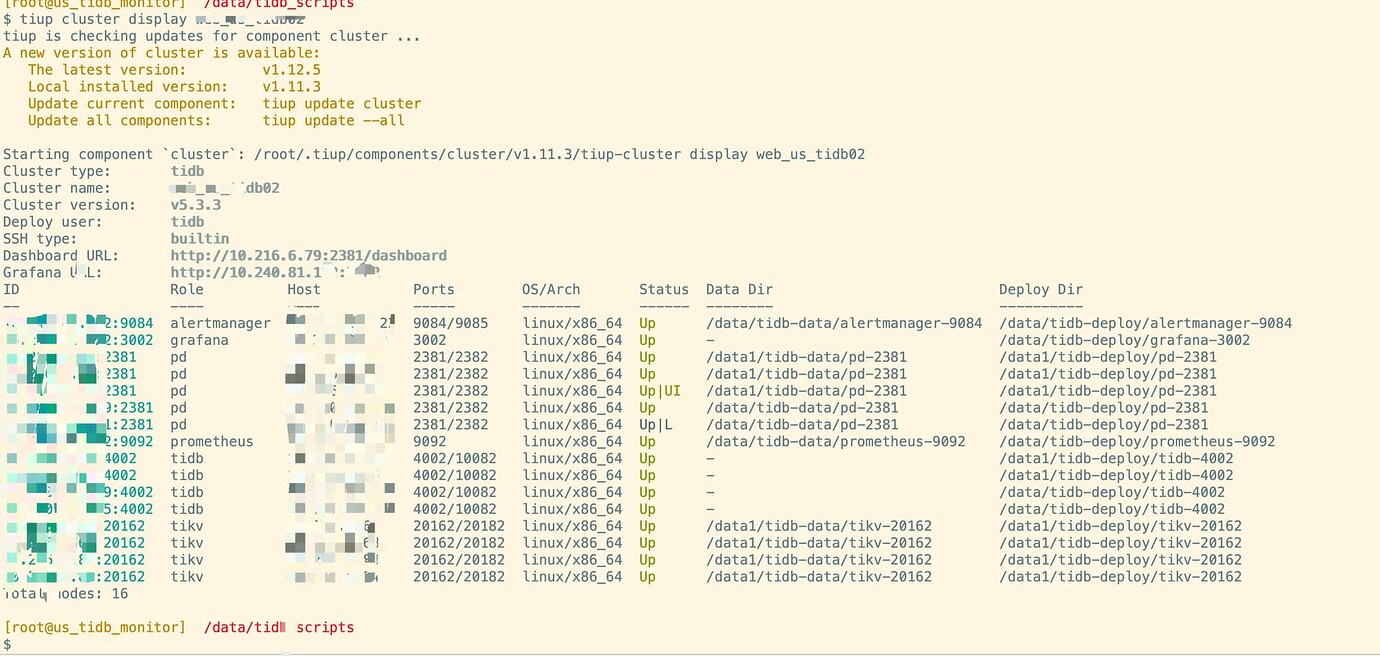
Original topic: tidb的pd节点缩容后,监控显示错误
【TiDB Usage Environment】Production Environment / Testing / PoC
【TiDB Version】
【Reproduction Path】What operations were performed that led to the issue
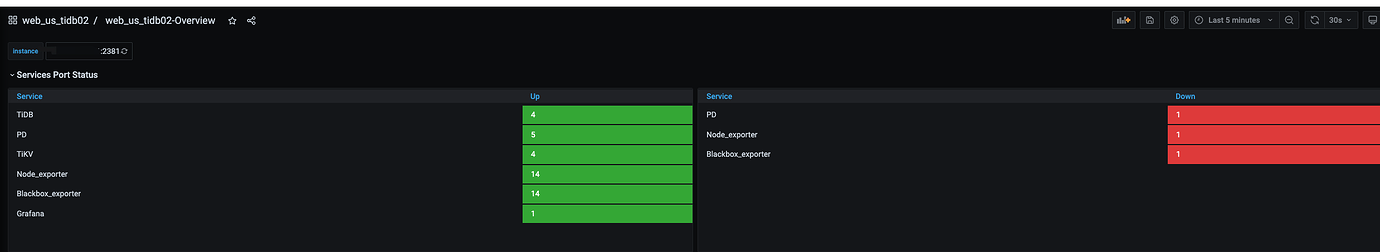
【Encountered Issue: Issue Phenomenon and Impact】
【Resource Configuration】Go to TiDB Dashboard - Cluster Info - Hosts and take a screenshot of this page
【Attachments: Screenshots / Logs / Monitoring】
Try restarting the monitoring by running tiup cluster reload <cluster_name> -R grafana,prometheus,alertmanager and check again.
Executed this reload, but it doesn’t seem to work.
After executing the reload, it recovered after 10 minutes. Thank you.
If you encounter issues with Grafana, Prometheus, or Alertmanager that cannot be resolved in the past few days, you can directly scale down and then scale up Grafana, Prometheus, and Alertmanager.
This topic was automatically closed 60 days after the last reply. New replies are no longer allowed.