Note:
This topic has been translated from a Chinese forum by GPT and might contain errors.
Original topic: tidb的tidb-server节点缩容后,监控显示错误
[TiDB Usage Environment] Production Environment / Testing / PoC
[TiDB Version]
[Reproduction Path] What operations were performed when the issue occurred
[Encountered Issue: Problem Phenomenon and Impact]
[Resource Configuration]
[Attachments: Screenshots/Logs/Monitoring]
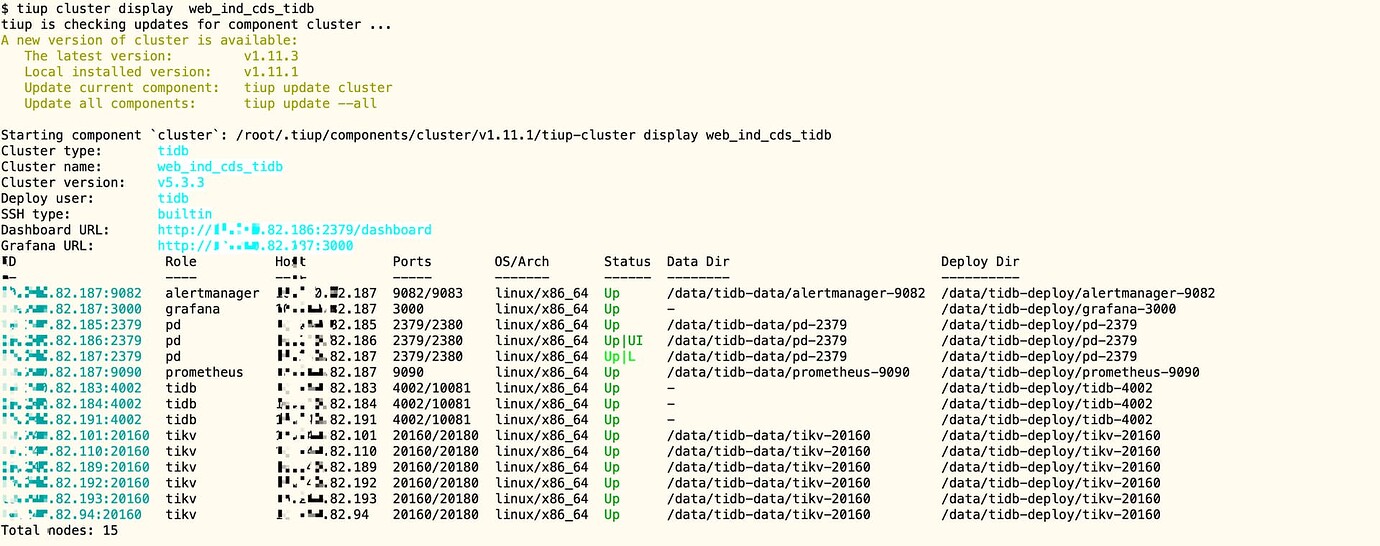
After scaling down a tidb-server node in TiDB 5.3.3, the monitoring panel shows errors.
Before scaling down:
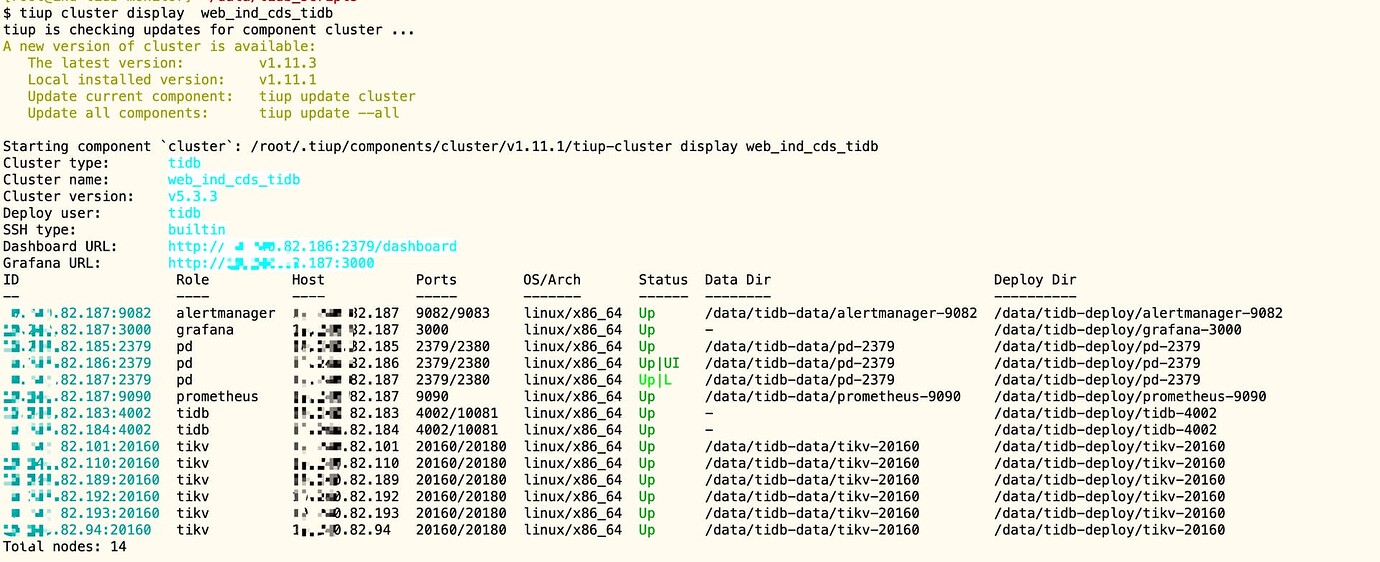
After scaling down:
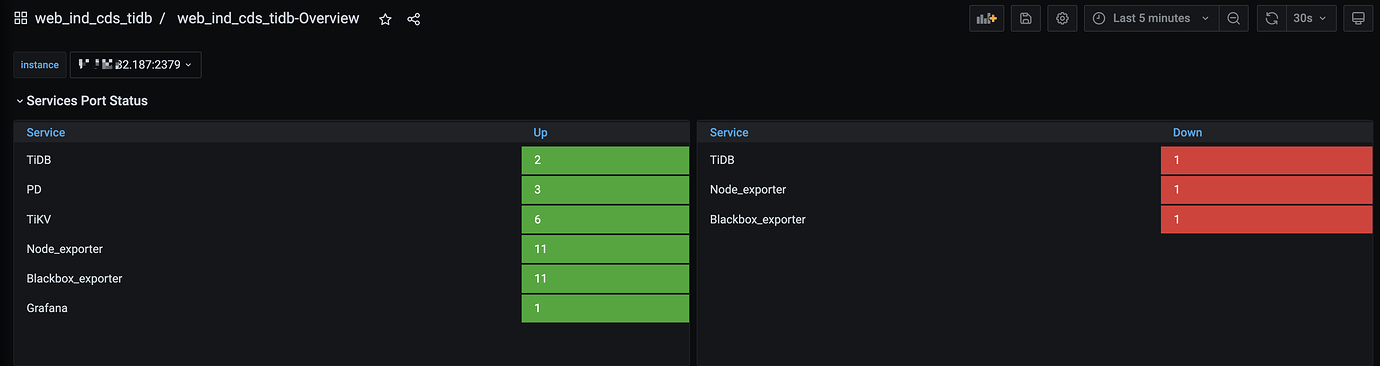
Monitoring panel:
Try reloading Prometheus and Grafana to see if the three down instances disappear.
You should restart the cluster, it seems like there is some residual information.
tiup cluster reload web_ind_cds_tidb -R prometheus
Will it be fine after a while?
I restarted the Prometheus node, but it still hasn’t disappeared.
I have executed this command, but it still doesn’t seem to work.
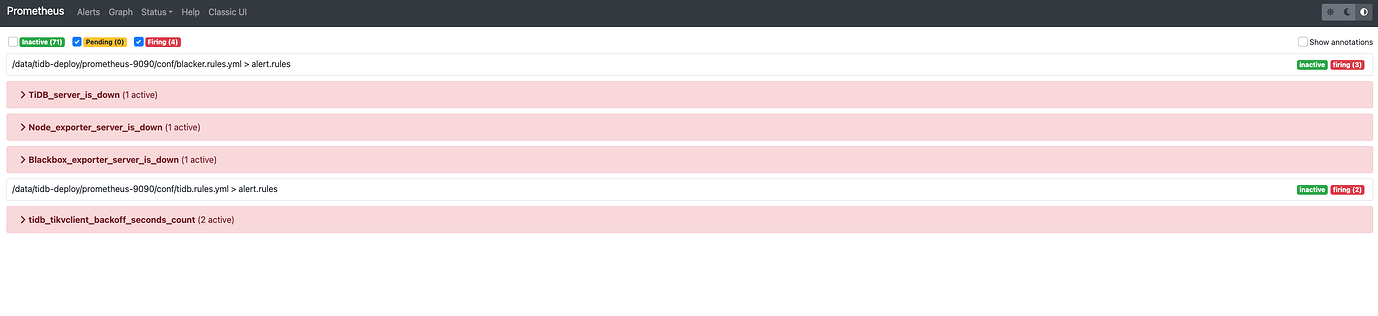
Prometheus, alert diagram:
Thank you very much. After executing
tiup cluster reload web_ind_cds_tidb -R prometheus
the alert disappeared.
Yes, using reload has solved the issue now. Thank you very much. I have scaled down several clusters without any problems, but why does only this cluster have this issue?
If it’s a metaphysical issue, can you accept it? 
Restarting is a good method.