Note:
This topic has been translated from a Chinese forum by GPT and might contain errors.
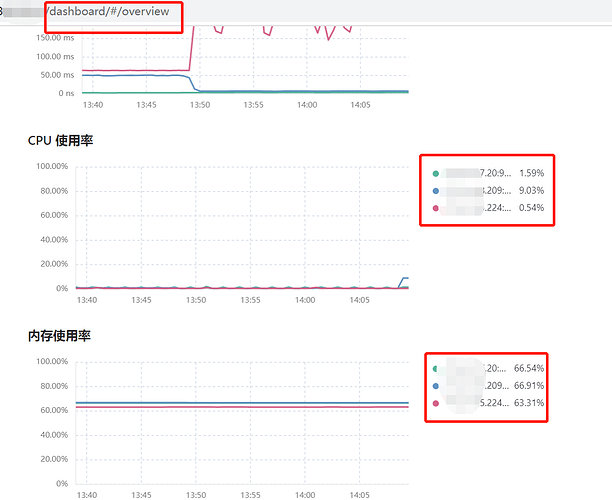
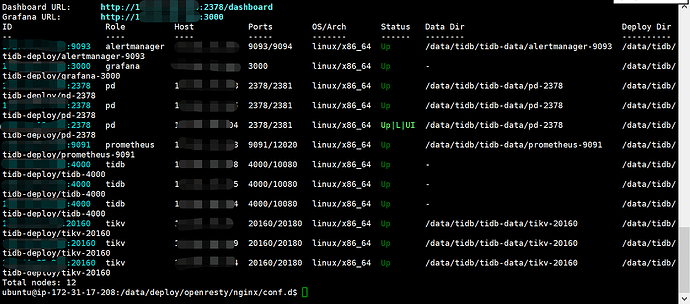
Original topic: 扩容缩容Tidb集群后,dashboard概述只显示部分节点信息
[TiDB Usage Environment] Production Environment
[TiDB Version] V6.1.3
[Reproduction Path] Initially, both internal and external IPs were used during deployment. Later, all external IPs were changed to internal ones through scaling in and out. After this change, the dashboard started having issues (the cluster has 6 servers, and 3 of them had their IPs changed), only showing information for the nodes that were not modified.
[Encountered Problem: Symptoms and Impact]
[Resource Configuration]
[Attachments: Screenshots/Logs/Monitoring]
If it appears in tiup cluster display but not in the dashboard, you can try restarting the PD node, the one with the UI.
Restarting the node didn’t help either. It seems to be because of this error.
This error is because your node_exporter did not start successfully. You can manually start it and check the logs for any error messages.
May I ask, has this issue been resolved?
Refer to the reply from the expert above and post the logs under the error node to take a look.
Is there no issue with the SSH configuration? The logs indicate that the command to start the node_exporter service via SSH did not succeed. Can you try executing it manually?
Check if there is a system node_exporter on the node. It is highly likely that the port conflict is caused by the system’s built-in node_exporter. In that case, you need to change the port of the system node_exporter.
Scaling in and then scaling out Prometheus will solve everything.
Buddy, has the problem been solved? Give me a best answer.


