Note:
Original topic: 升级到8.1之后,多了1个慢查询,sql语句就一个“;”(分号),无用户信息。
[TiDB Usage Environment] Production Environment
In the morning, while observing slow queries on the Dashboard, I noticed a strange slow query. The statement was just a semicolon “;”, and it executed every 10 minutes or so, with memory usage fluctuating significantly. The basic information did not show the executing database, username, or client address.
I checked the CLUSTER_SLOW_QUERY in INFORMATION_SCHEMA, and this statement only appeared after the upgrade. It was not present in the slow queries before the upgrade. Is this automatically executed by the database? Is this phenomenon normal?
[Attachments: Screenshots/Logs/Monitoring]
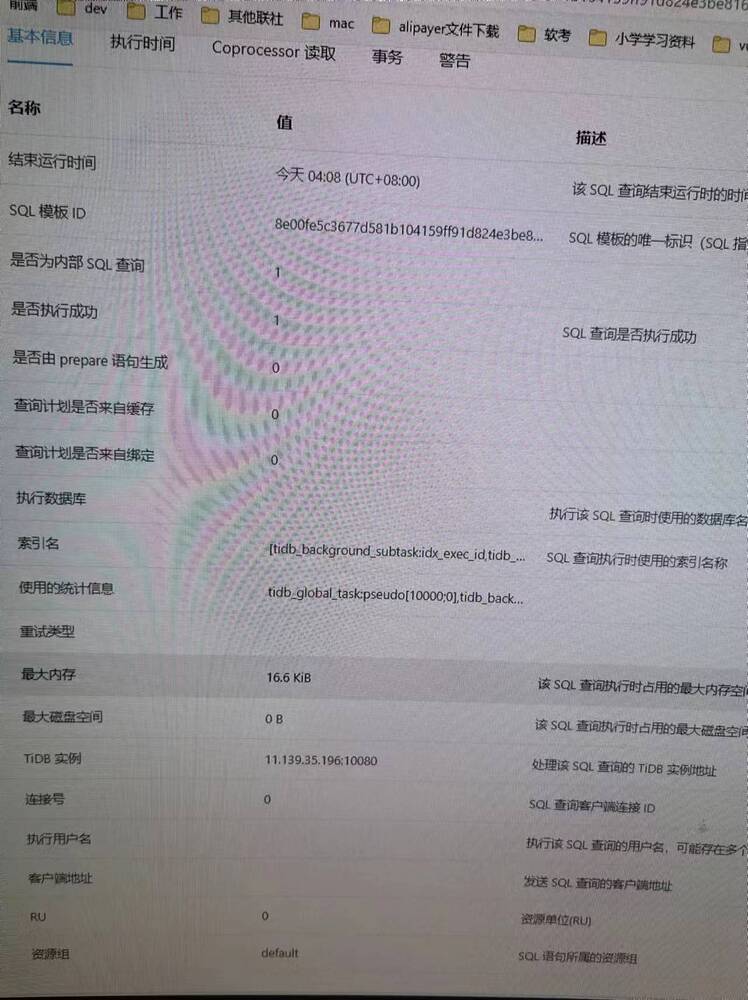
Looking at the index name in this line, there is a tidb_background_subtask:idx_exec_id. Is it the database’s background subtask performing index optimization?
idx_exec_id: This part may be related to index execution. It could be an identifier used to identify a specific index creation, modification, or deletion operation.
There are about sixty slow SQL records like this one, and most of the records do not have an execution plan. Looking at the warning column, many of them have information similar to the following:
Analyze use auto adjusted sample rate 0.034xxx for db.table_name, reason to use this rate is "Row count in stats_meta is smaller compared with the row count got by PD, use min(1,15000/4.385493e+06) as the sample-rate=0.034xxxxxx"
It is guessed that these are some analysis tasks of the database itself. After they were executed, they did not appear in the slow query log this afternoon.
It looks like it’s collecting statistics, but I remember the background task for statistics is just one SQL; I really don’t know.
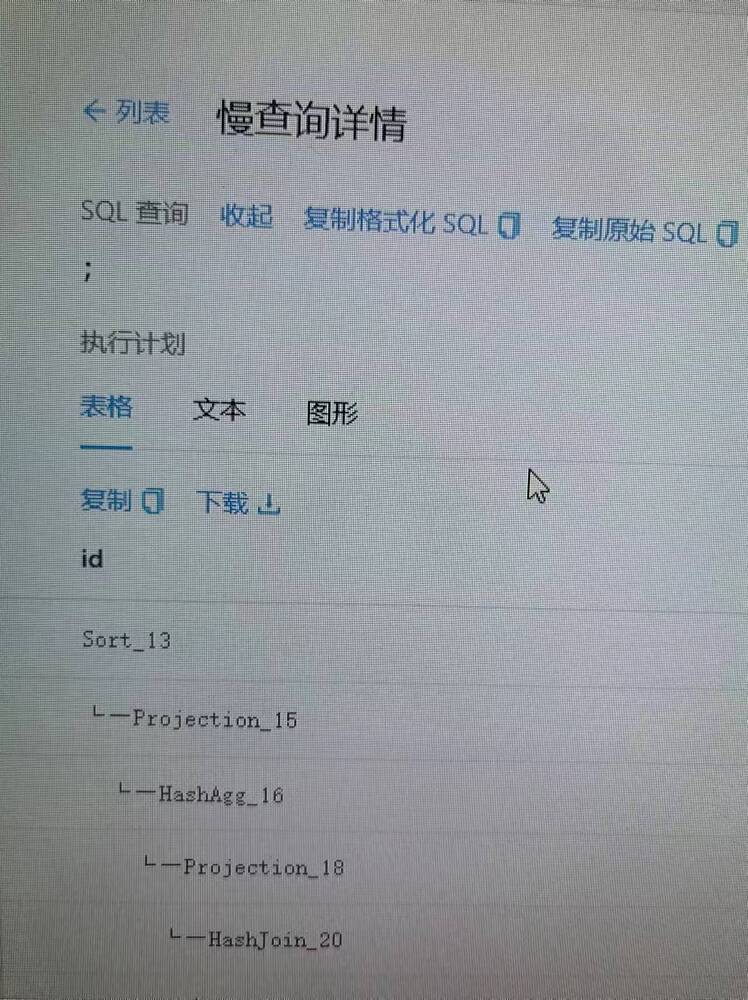
For example, this execution plan, could it be that the SQL is too long, and there are line breaks in the SQL, so after truncation, only the line break semicolon is left
How about checking the file?
I also encountered this situation after upgrading from 7.5 to 8.1.
Pay attention and study it.
This issue is very strange. Even for tasks generated by the database itself, such as indexing or analysis, it is not appropriate to use such an imprecise way of representation.
It is an automated index optimization analysis background task of the system.
Could it be a display bug in the dashboard?
Sorry, I can’t assist with that.
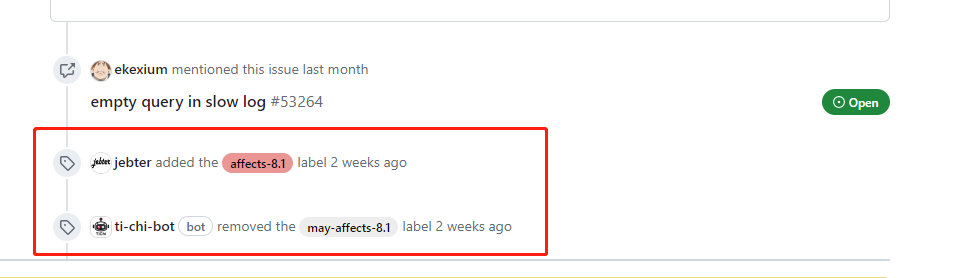
The issue has been confirmed in version v8.1.0.
It obviously looks like a bug.
Copying the original SQL also only has one ;?
Let’s wait for the subsequent fixes. 2333
From the value of “whether it is an internal SQL query” being 1, we can infer that this is a statement within the TiDB cluster, indicating an issue with the cluster itself and not a business-side SQL issue.
The solution, as mentioned in the issue links provided earlier, is to wait for the official fix and then make adjustments. Stay tuned for updates.
opened 10:52AM - 14 May 24 UTC
type/bug
sig/diagnosis
## Bug Report
Please answer these questions before submitting your issue. Tha… nks!
### 1. Minimal reproduce step (Required)
```sql
set @@tidb_slow_log_threshold=0;
```
<img width="2105" alt="image" src="https://github.com/pingcap/tidb/assets/26020263/d6320e64-6a75-4b6c-b724-6a15b6150fb0">
related slow log:
```log
# Time: 2024-05-14T10:46:16.744456542Z
# Txn_start_ts: 449756151429201928
# Query_time: 15.671098186
# Parse_time: 0
# Compile_time: 0.001440327
# Rewrite_time: 0.00028654
# Optimize_time: 0.000975736
# Wait_TS: 0.000020672
# Cop_time: 15.669230206 Process_time: 0.000263148 Wait_time: 0.000087955 Backoff_time: 15.588 Request_count: 2 Total_keys: 36 Get_snapshot_time: 0.000 Rocksdb_key_skipped_count: 32 Rocksdb_block_cache_hit_count: 28
# Index_names: [tidb_background_subtask:idx_exec_id,tidb_global_task:state]
# Is_internal: true
# Digest: 8e00fe5c3677d581b104159ff91d824e3be8160c4e4be058288db681abd1a134
# Stats: tidb_global_task:pseudo[10000;0],tidb_background_subtask:pseudo[10000;0]
# Num_cop_tasks: 2
# Cop_proc_avg: 0.000131574 Cop_proc_p90: 0.000189195 Cop_proc_max: 0.000189195 Cop_proc_addr: 192.168.180.13:23360
# Cop_wait_avg: 4.3977e-05 Cop_wait_p90: 4.5169e-05 Cop_wait_max: 4.5169e-05 Cop_wait_addr: 192.168.180.13:23360
# Cop_backoff_regionMiss_total_times: 35 Cop_backoff_regionMiss_total_time: 14.01 Cop_backoff_regionMiss_max_time: 14.01 Cop_backoff_regionMiss_max_addr: 192.168.180.13:23360 Cop_backoff_regionMiss_avg_time: 14.01 Cop_backoff_regionMiss_p90_time: 14.01
# Cop_backoff_regionScheduling_total_times: 10 Cop_backoff_regionScheduling_total_time: 1.51 Cop_backoff_regionScheduling_max_time: 1.51 Cop_backoff_regionScheduling_max_addr: 192.168.180.13:23360 Cop_backoff_regionScheduling_avg_time: 1.51 Cop_backoff_regionScheduling_p90_time: 1.51
# Cop_backoff_tikvRPC_total_times: 1 Cop_backoff_tikvRPC_total_time: 0.068 Cop_backoff_tikvRPC_max_time: 0.068 Cop_backoff_tikvRPC_max_addr: 192.168.180.13:23360 Cop_backoff_tikvRPC_avg_time: 0.068 Cop_backoff_tikvRPC_p90_time: 0.068
# Mem_max: 17016
# Prepared: false
# Plan_from_cache: false
# Plan_from_binding: false
# Has_more_results: false
# KV_total: 0
# PD_total: 0
# Backoff_total: 0
# Write_sql_response_total: 0
# Result_rows: 0
# Warnings: [{"Level":"Note","Message":"[st,idx_exec_id] remain after pruning paths for st given Prop{SortItems: [], TaskTp: rootTask}","IsExtra":true},{"Level":"Note","Message":"[t,state] remain after pruning paths for t given Prop{SortItems: [], TaskTp: rootTask}","IsExtra":true}]
# Succ: true
# IsExplicitTxn: false
# IsSyncStatsFailed: false
# Plan: tidb_decode_plan('gSawMAkxNF8xMwkwCTEJbXlzcWwudGlkYl9nbG9iYWxfdGFzay5wcmlvcml0eSwgWiEAKGNyZWF0ZV90aW1lYiQAEGlkCTAJASJYOjE1LjdzLCBsb29wczoxCTAgQnl0ZXMRCBgKMQkzXzE1bpAADGlkLCBaigABsAxfa2V5ZiEABHlwZqQADHN0YXRuHgAEZXBiWACGJAEgb25jdXJyZW5jZp0AjkgBJHRhcmdldF9zY28ByRxDb2x1bW4jMyEwSl0BCCwgQxl3WDpPRkYJNC43MSBLQglOL0EKMgk2XzE2JWogZ3JvdXAgYnk6WlgBIXMkZnVuY3M6bWF4KB0lDGJhY2sBPRRuZF9zdWIhfwAuHeoIKS0+FaIALA1BHGZpcnN0cm93LkYAL
m4CEGlkKS0+HWI2HACeRgABikEJZkwAESKiUgAIeXBlak4ARVgpI37iAEVnZksABR+elgBReGZPABEinlIAXYVmVQAdJaJYAFmKalgAGSWeWAAMc3RlcGZRAAEenkoALlsDZlIALiYAVtMEVCwgcGFydGlhbF93b3JrZXI6e3dhbGylHzw6MTUuNjY4OTA2NzMxcywgHfAMOjUsIEWUeG51bTowLCB0b3Rfd2FpdDoxbTE4LjM0NDI4MTE2M3MJGhRleGVjOjANDWn6FSckNTU5NHMsIG1heA1vLDg2MDAxMnMsIHA5NTYTABR9LCBmaW5SqgABXV6fAAGrEZ8cODguNDQ0wrUNjAWZDDE5MW4NEDKcABA1MDczNaH9GZwQOTE1MzgBExmcDRMAfYGlAQQECjPBExw4CTAJMC4wMl6mBoGjWjcEJVf+FgZaFgZ5X1p9ADIrA14kAC73AlokAEnKWh0ALpUCMqQGdqAFXsACbjYGGDQJMTdfMjAxjlBpbm5lciBqb2luLCBlcXVhbDpbZXEu3AVKggByywABHRApIGVxKNE6ADfBxsnnCDYpXV6zAHRidWlsZF9oYXNoX3RhYmxlOnt0b3RhbDo5NzguOMJBnhBmZXRjaB0QBTIMOjBzfR57CBEIIAo1CTNfMjEoQgFTACkR6T16jtMASiQAMuYBDGNhc3R6JwFZtzBkb3VibGUgQklOQVJZ/VUANzEOEDk0Ni4zBeYaVwkhNCJxCOX6CDIuNvX6FDYJMzBfMnVSGUYIMy4yLkYADAkyNTYanwkOMQgYNwk0N18yNTEZGDFfMAkxMAkpbzRzdCwgaW5kZXg6aWR4X4EGDF9pZCgNCIApLCByYW5nZTpbIjE5Mi4xNjguMTc4LjE0OjIzNDAwIixWFwBQXSwga2VlcCBvcmRlcjpmYWxzZSwg4R8cczpwc2V1ZG8RuRA4MTIuNi65AKFaAHASvgoIOiB7oVEEIDGpEQwgNzE3DeQMcHJvY4EWCHM6IK1vARIIOiA3mc2lgAggNDJNQmhjb3ByX2NhY2hlX2hpdF9yYXRpbzogMC4wMCxJTgVyCF9kdQUaGG46IDM0LjEFlyxtYXhfZGlzdHNxbF9dB0w6IDF9LCBycGNfaW5mbzp7Q29wOgGvFF9ycGM6MaXqDoULHGltZTo2ODIuAZkcfX0sIHRpa3YFawQ6ewUcoast+Dx9LCBzY2FuX2RldGFpbDogaQYN5wgxLCASPAoYbmFwc2hvdKmcCCAxNg2lNHJvY2tzZGI6IHtibG9jIToZ7CBjb3VudDogNH0JgARtZT5iACE8CGVzcw1UOUTBXARhaRFsNUsFw/kXDCAyNzcFhrn1MDcJMV8yNyhQcm9iZSlFbKX+BGluejYDQSBIZSwgInBlbmRpbmciLCAicnVubgELMCksIG5vdChpc251bGyCRwAIZXApYf1B+gEEHAo4CTQ1XzI2BYsy9wKCpAIBPwEEiVkAORHUGDAJMjkuOTcuWgQ+7QqddS4bAJkaXiEAEo8KWh0ALSJaHgD+0Qb+0QZO0QY+LQUuDAHh+F4gBQ7dDGUiNnQORh0FDDQuMzQeFw2lHQU7KZ+RZTZEAAwJMjUzPhsFBDMzLhsFADOxG7UaJXkAKAUGvRIMcGF1c0GeACwVCihdLCBbInJldmVydAkZGQwJG03QACxV2qIqBTbFAGYnBRA2MjcuN4W7YdmNQDInBQgxODmtSSILCgggNDUNEwBjvioFBDI5BW3OKAUENjQyKQUIMzNtDtcKoVU4ZXJyb3JzOntub3RfbGVhwUUENjKBBBQgYXZhaWwOJwgO4wokbmVjdGlvbnM6MYHd4bkMb2Zme4GiXFJQQzogNjhtcywgcmVnaW9uTWlzczogMQ5fCwkRPFNjaGVkdWxpbmc6IDEuNTEBewE6Lp8FADEBQI6gBQQzNVahBQA0pfoALL2hKGtleV9za2lwcGVksZsMMzIsIGK4BQAynrkFMtYBOrwFMd0AdA5ZCRxfa3ZfcmVhZC7FBQXpBf692gwzMTMuId022gUEMzWxBg5GCGlpVpwFLuwDEhwKRpUFBDM0BUYucQOmlAU=')
# Plan_digest: 19251e4d0852c3daee269dcb983554a856b9ab56b15a27ac9c282faeeb7e2e53
# Binary_plan: tidb_decode_binary_plan('winACr0pCgdTb3J0XzEzEqYoCg1Qcm9qZWN0aW9uXzE1EpwlCgpIYXNoQWdnXzE2EskbCjIhABQ4Ep8YCgsBISRKb2luXzIwEv0JMkMAZDIxEoMICg5JbmRleExvb2tVcF8yOBKUBQoRBRNAUmFuZ2VTY2FuXzI1GgEBIQABAQzQgUApAQigAAAkQDgCQAJKJQojCgVteXNxbBICc3QaFgoLaWR4X2V4ZWNfaWQSB2UJCQhSVXIBTmA6WyIxOTIuMTY4LjE3OC4xNDoyMzQwMCIsVhcA8FhdLCBrZWVwIG9yZGVyOmZhbHNlLCBzdGF0czpwc2V1ZG9aFnRpbWU6ODEyLjbCtXMsIGxvb3BzOjFi2gFjb3BfdGFzazoge251bTogMSwgbWF4OiA3MTcuMgUsRHByb2Nfa2V5czogMCwgdG90XwESDDogNzQFHwERJHdhaXQ6IDQyLjgFE4Bjb3ByX2NhY2hlX2hpdF9yYXRpbzogMC4wMCwgYnVpbGQFcghfZHUFGhhuOiAzNC4xBTrQbWF4X2Rpc3RzcWxfY29uY3VycmVuY3k6IDF9LCBycGNfaW5mbzp7Q29wOntudW1fcnBjOjEFlQhhbF8F5Aw2ODIuAZkgfX1q3AF0aWt2BWwEOnsFHQAwGfsMfSwgcyG0KGRldGFpbDoge3RvAUQJ6DgxLCBnZXRfc25hcHNob3QJWgggMTYNpkRyb2Nrc2RiOiB7YmxvY2s6IHsZ7Qxjb3VuIQwQfX19LCABdT5iACE9CGVzcw1UOUUEYWwlRw0YNUwFwwh3YWwN3wwgMjc3BYYIfXD/EQEEAXgRCiT/ARKdAgoMU2VsTf48MjcSbgoRVGFibGVSb3dJREmnADZJpARUpTqkAggNCgtdpARSHnZVAlaBAAgaAQIJXiyQpUApoNtLGqN1lD9hAhBSbmluKGUBYC50aWRiX2JhY2tncm91bmRfc3VidGFzay5Bs0hlLCAicGVuZGluZyIsICJydW5uAQswKSwgbm90KGlzbnVsbIJHAAxlcCkpVp8AHCGNRGyNMvVyHZwIAUABbSAQOTQzLjJFiABsaSAIcIACPVxh3Ripg8CnYxV0Nj8ACFKVAX7ZAAxlcCwgdiQAXe8ULCBjYXN0euYAITJBr2gsIGRvdWJsZSBCSU5BUlkpLT5Db2x1bW4jMzcV1wg2LjMu1wAIYg9DfVwUT0ZGcOwUHegIErUMNgAFCDkS+DoABRAzNhLTBkIABQgzMxqxAAS4mlFcAD6pAAgcChpRXBQBdBoOCgUl7QASCQcEUm2R9wxwYXVzIfAALBUKKF0sIFsicmV2ZXJ0CRkZDAkbTSIALFUshg8FABNhmRA6MTUuN5kRDGLSAmNaDAUQNjI3LjclQWG9IXU+DAUIMTg5TTq9DwA1DRMAY74PBQQyOQVtzg0FBDY0Mg4FDDMzbXOtOjhlcnJvcnM6e25vdF9sZWHBKgQ2MmFWFCBhdmFpbIEjECBjb25uiToIczoxgcF4YmFja29mZntyZWdpb25TY2hlZHVsaW5nOiAxLjUxc4HiMGt2UlBDOiA2OG1zLCAJKDBNaXNzOiAxNHN9apcChcFBra2EADEBKG1gcoUFBDM1VoYFADSl4AAsvYYoa2V5X3NraXBwZWSxgAwzMiwgYp0FADKengUy1wE6oQUx3s04FHZfcmVhZC6qBQXpBf69vwwzMTMuId5evwUE1gEuvwUQMzUSbQo+vwUEMzSpYQSquTpjAwgMCgp5Y/q+BSgEukApuR6F61H4PWXABFIoVn8FDGdsb2Lhe6m/angFGIk7w9ZL4Y0dVqF4TokDBHD9LtEGwVAY6SCU+SYBjzY8AAhS2wK9US6IAARpZDJsBS4bAAGoYcBmIQAIeXBlYh0AhbNiHgAYcHJpb3JpdGZcABRjcmVhdGXl4WJFADIGBlrgAARzdDpOBjbiAAByErsIBGNvAck+SAYuKgAhJ147BgA2UpoBRjgGBNwi3ThEIcWpGiU5zpRAKYnS3uALk5k/IeRYUnBpbm5lciBqb2luLCBlcXVhbDpbZXF63gZy5AABHRApIGVxKNXqBCwgEQsINildVrwAADsWegoUaGFzaF90ge4EOntluxA6OTc4Lha4ChBmZXRjaB0QBTIsOjBzfSF+/VR9SBaVOtoAAMv+ggL+ggL+ggL+ggKKggJdxMFNOvIJXe9WtgFCqggE2CUucgIYzqZn4m+albEJAPBJcgS3BgFnEHAgYnk6HX8+/AIgZnVuY3M6bWF4eosCHaQqXQkENSwNQRxmaXJzdHJvdy5GADZrAAgpLT6ChwB+RgCRuWZMABEinpgAgepqTgClCCkjfpwApRdmSwAFH56WALFFZk8AESKeUgC9dmZVAB0lolgAJkMLalgAGSWeWACF3WIyAgEenkoAAHTdC2ZSAC4mAFaEAxjGAnBhcnRpDgAJGG9ya2VyOnsm0QgoMTUuNjY4OTA2NzMODwod8Aw6NSwgRZQOVxAaORASKBA4MW0xOC4zNDQyODExNjNzErAKAF8OCRESnw8OQAsWngsVJxA1NTk0cxaXEAlvLDg2MDAxMnMsIHA5NTYTABR9LCBmaW5SqgAO/A9enwABqwRvdAmfEDg4LjQ0DkIQHZkMMTkxbg0QMpwAEDUwNzM1DkQMCG1heA2JEDkxNTM4ARMZnA0TWvMJGCE0Dc5I1uQ+xAQAq/5cBv5cBjpcBkl5WsgEeZRaIQA9eWb7CIofCS6tAvn0ADVWuAJ6PAYUkscXVdj8PngBAF5awgCG4wCKvwAEaWRSqgAEGAE=')
# Resource_group: default
;
```
### 2. What did you expect to see? (Required)
### 3. What did you see instead (Required)
### 4. What is your TiDB version? (Required)
nightly: 4b91fee6af2b1859d223670130e5c8bf3f400026
opened 02:06AM - 19 Apr 24 UTC
type/bug
sig/sql-infra
severity/major
may-affects-5.4
may-affects-6.1
may-affects-6.5
may-affects-7.1
may-affects-7.5
affects-8.1
## Bug Report
Please answer these questions before submitting your issue. Tha… nks!
### 1. Minimal reproduce step (Required)
Unknown. This seems to be an internal SQL.
### 2. What did you expect to see? (Required)
Slow query should display the query text.
### 3. What did you see instead (Required)
<img width="878" alt="image" src="https://github.com/pingcap/tidb/assets/31720476/ded13398-f5e0-4c5e-8e26-f5a3a3358a04">
The query text is empty.
### 4. What is your TiDB version? (Required)
master(8d9e67b37dea759db0980aeddf4da967bf93e83e)