Note:
This topic has been translated from a Chinese forum by GPT and might contain errors.
Original topic: 应用卡,tidb性能问题如何调优
Version: 5.7.25-TiDB-v5.4.0
Deployment method: k8s
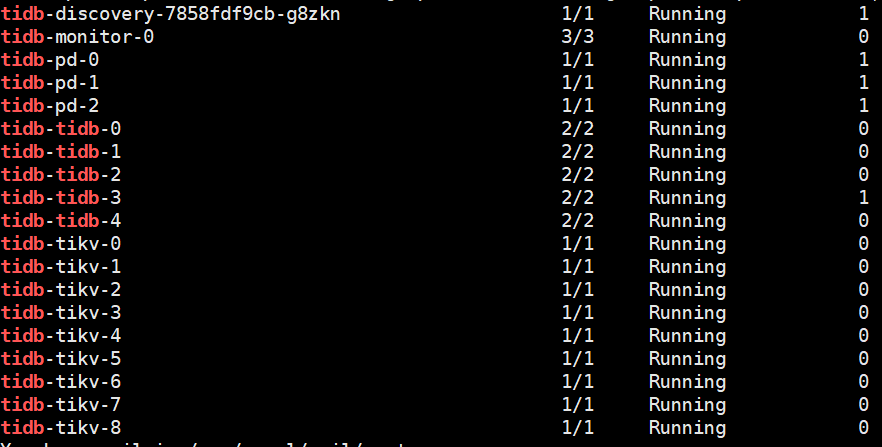
Node status:
Questions:
-
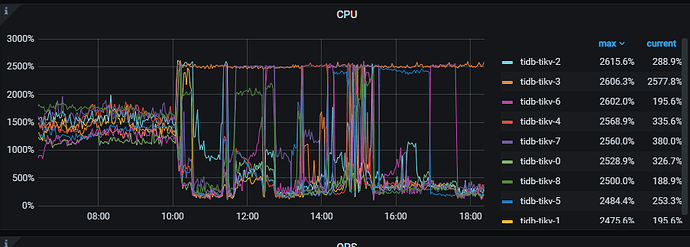
TiKV nodes often have high CPU usage on some nodes, and the CPU usage across different TiKV nodes is uneven, which seems to be a hotspot issue. The following figure shows that at different times, one or two POD nodes always have high CPU usage, causing physical machine CPU alarms at different times. How can I locate and solve this problem to optimize it?
-
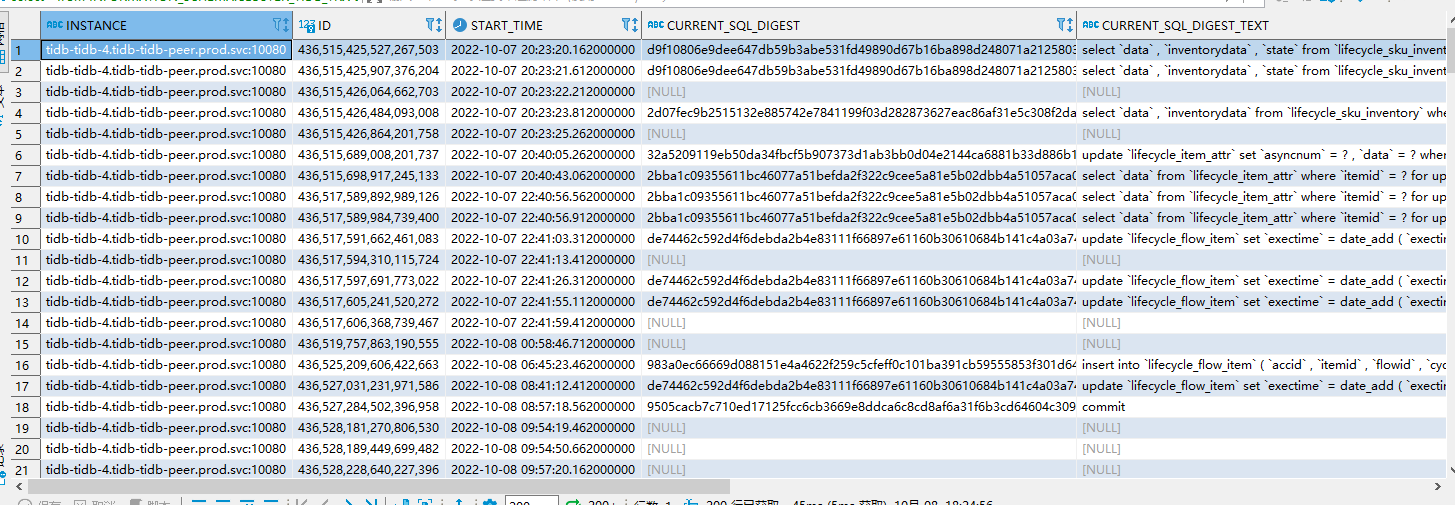
Using select * from INFORMATION_SCHEMA.CLUSTER_TIDB_TRX tt order by start_time to query cluster transactions, I found that the transaction has been running for a long time (the time difference shows 8 hours). Using MySQL’s method to kill this transaction (kill session_id, going to the specific TiDB instance to kill also doesn’t work), how can I kill the transaction?
-
Executing a SELECT statement results in a timeout error: Coprocessor task terminated due to exceeding the deadline. What kind of error is this?
-
Database error: [type] => default:8027 [info] => Information schema is out of date: schema failed to update in 1 lease, please make sure TiDB can connect to TiKV. What is the reason for this?
-
Executing a table query results in an error: inconsistent index idx_cosume handle count 349 isn't equal to value count 348. Executing admin CHECK INDEX ims._of_com_mq idx_consumer reveals that the table record count and index record count are inconsistent. Why does this happen, and how can it be resolved? I tried deleting the index and recreating it, but later executing admin check resulted in the error: Coprocessor task terminated due to exceeding the deadline.
-
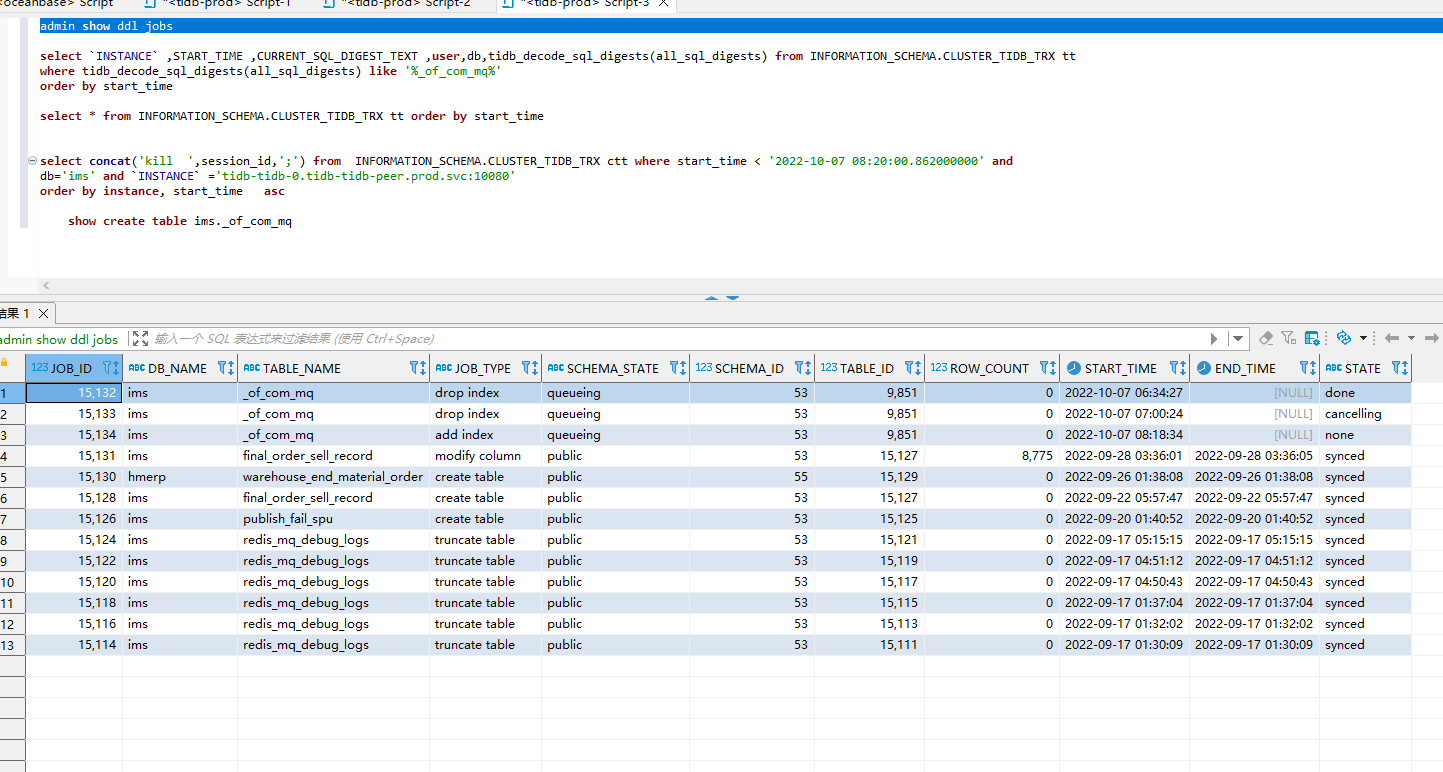
During the fifth step of executing admin check, it got stuck and didn’t respond for a long time. Checking admin show ddl jobs, I found the following issue:
Why is there a queueing status, and who is it waiting for? When executing cancel, it still remains the same. How should this be handled?
-
Checking the slow SQL in TiDB’s dashboard, I found it to be very slow. Why is this monitoring area so slow? Is it because querying the data in etcd is too slow, or is the data volume too large?
Let me solve this for you, please wait a moment while I organize my thoughts.
What is the physical machine configuration and the distribution information of the pods?
- It may not necessarily be a hotspot issue; high CPU usage is due to slow queries, which can be optimized.
- Use
kill tidb +id.
- It is related to cluster load, and slow queries still need to be optimized.
- Slow query: Information schema is out of date: schema failed to update in 1 lease, please make sure TiDB can connect to TiKV"] - #4,来自 jshan - TiDB 的问答社区
- It is related to cluster load.
- Queueing and waiting for scheduling might be due to TiDB leader not being scheduled successfully. Does it only occur during peak times and not during regular times? You can check the TiDB leader logs.
- Also, check the memory table
information_schema.cluster_slow_query.
In summary, if there were no issues before, you can start by optimizing slow queries to reduce cluster load.
The TiKV nodes are distributed across 7 physical machines, with the following configurations:
40-64 core CPUs
Memory is
Disks are all SSDs
However, each physical machine also hosts other applications, such as MySQL, Elasticsearch, Java, PHP, etc.
Since all our deployments are done using Kubernetes, including the MySQL database, many applications share the host resources.
Thank you for your reply. Regarding killing a transaction, I would like to ask:
Is it kill tidb id or kill tidb session_id?
Because I tried kill tidb id (for example, here it is: 436515425527267503); it would wait for a long time without any response as shown in the above picture, even if I entered the corresponding tidb-4 instance, it was the same.
If I use kill tidb session_id (for example, here it is 117823), although it prompts success, the transaction still exists when queried again.
When in doubt, first check the Dashboard to see if there are any slow SQL queries, Top SQL, or hotspot maps. Make a quick assessment, and then investigate further.
Your issue is similar to one I encountered before. Based on the information you provided, it should be a cluster load problem.
In this situation, our solution is to first identify the slow SQL queries and then resolve them, which basically fixes the issue.
He privately messaged me that their TiDB and business are using the same K8s, and they haven’t implemented slow SQL restrictions, so it gradually became sluggish.


