Note:
This topic has been translated from a Chinese forum by GPT and might contain errors.
Original topic: 扩容tikv后为自动均衡
[TiDB Usage Environment] Testing
[TiDB Version] V6.4
[Reproduction Path] Use scale-out to expand TiKV, expanding from 1 TiKV to 3 TiKVs per node. Expanded twice, each time adding 3.
[Encountered Issue: Phenomenon and Impact] After expansion, the TiKV status appears normal, but regions are not automatically balanced. It is uncertain whether the expanded TiKVs are properly activated.
[Resource Configuration]
[Attachments: Screenshots/Logs/Monitoring]
Why not use 6.5.X? Why use 6.4?
If the service is running normally, automatic balancing needs to wait because scheduling and execution take time.
Check the schedule status and config to see if these parameters are correct.
I installed it a long time ago, and back then the latest version was 6.4. It’s been a whole night already, and with just over 100GB of data, it shouldn’t take this long, right?
You can check cluster-pd → Operator → Schedule operator create to see if there is any scheduling generated.
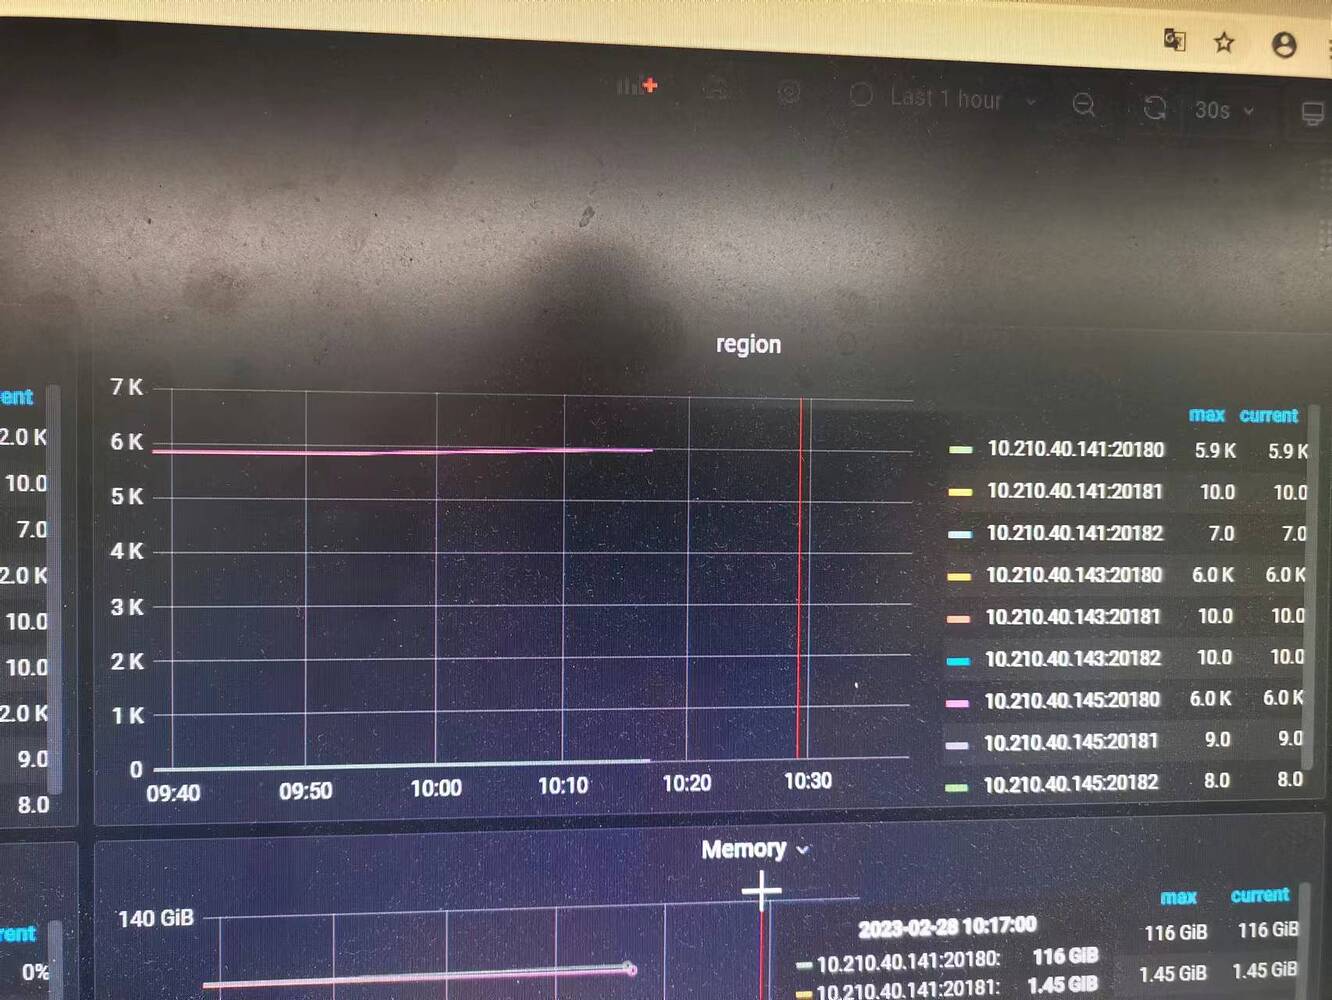
It looks like your monitoring has had no data for a long time, try restarting Prometheus. Check the leader_count and region_count in information_schema.tikv_store_status to see if they are balanced.
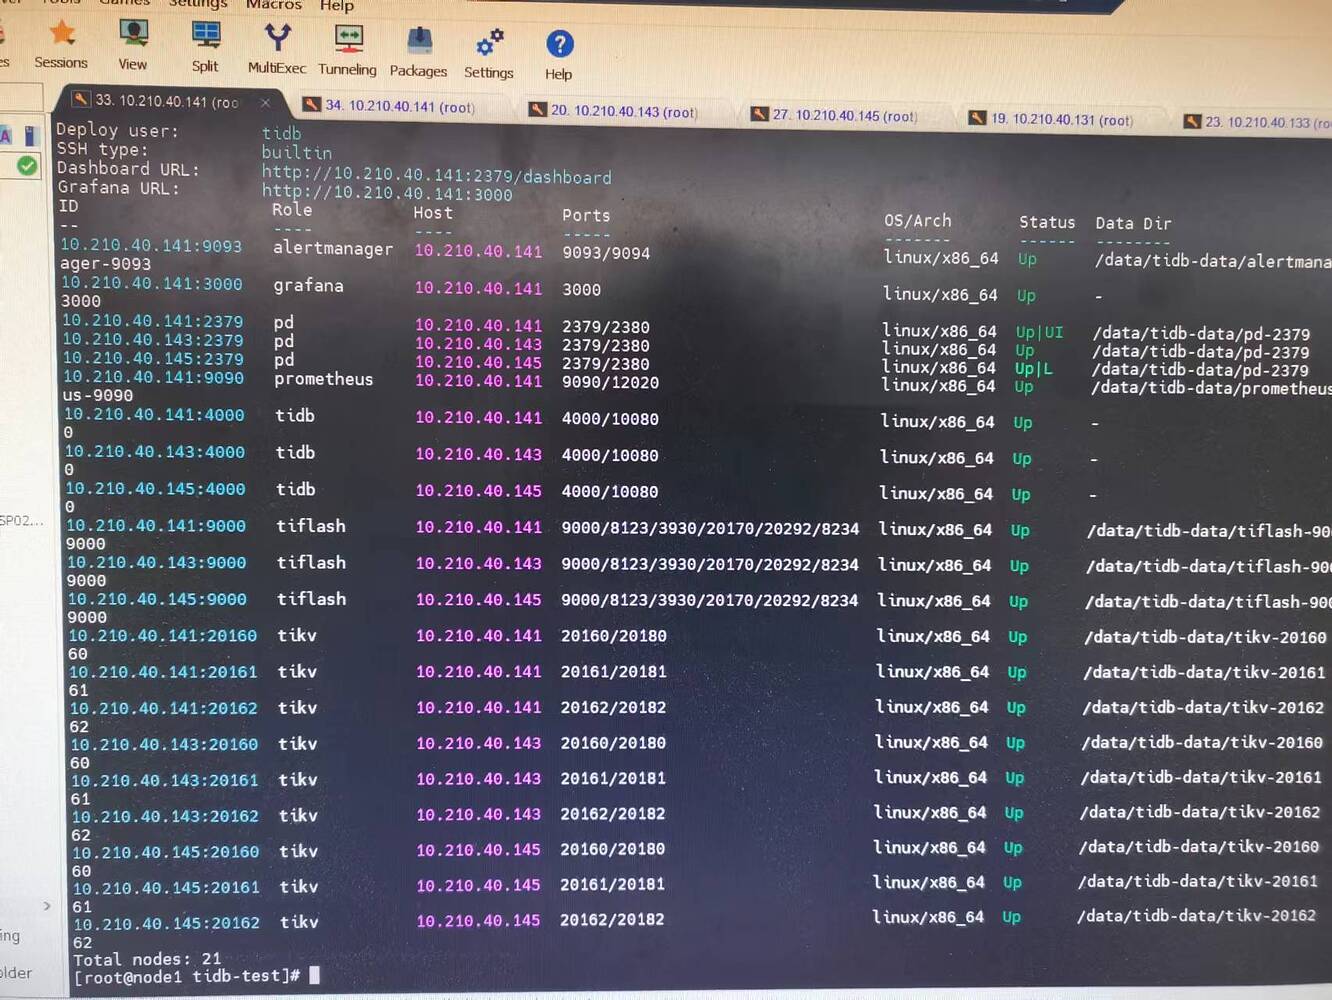
The parameters are expanded as shown in the screenshot, so there should be no problem, right? Can multiple TiKV instances be deployed on a single physical machine? I remember that as long as the ports are different, it should be successful, right?
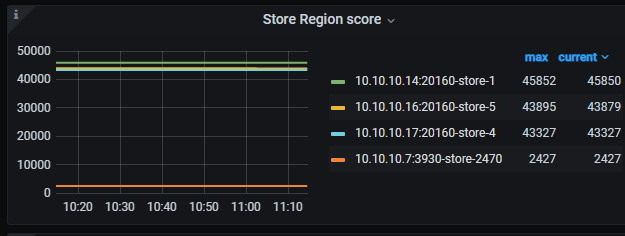
PD → Statistics Balance to view the store region scores and the number of regions on each node.
There is monitoring data. The results in the screenshot are the same as querying the system table.
Indeed, the scores are unbalanced. Each node has 3 TiKV instances, but there are 4 stores. It’s similar to node 145 in the screenshot, where one is very high and the other two are very low.
Is there a label set? Has the newly added TiKV been set?
It looks like a PD Leader switch occurred in your diagram. Try switching the instance in the top left corner and see.
It’s actually quite normal to process 100G overnight. Try adjusting the add peer speed using pdctl store limit. By default, TiKV scheduling is indeed slow. I believe the default value is 150; you can directly adjust it to 2000 and then revert it after the data is supplemented.
For specific operations, you can refer to: PD Control 使用说明 | PingCAP 文档中心
There is no configuration, and there wasn’t any before either. I checked the meta.yaml and there doesn’t seem to be any issues.
It seems like there’s no difference.
It seems that TiKV didn’t start up. Reload the data, and the expanded TiKV didn’t see an increase in regions either.
Check if there are many empty regions.
There aren’t many empty regions, but regions with more data occupy a lot of space.