Note:
This topic has been translated from a Chinese forum by GPT and might contain errors.
Original topic: tidb集群,我可以关掉prometheus与grafana、alertManager这些组件吗?
[TiDB Usage Environment] Testing
[TiDB Version] 7.6.0
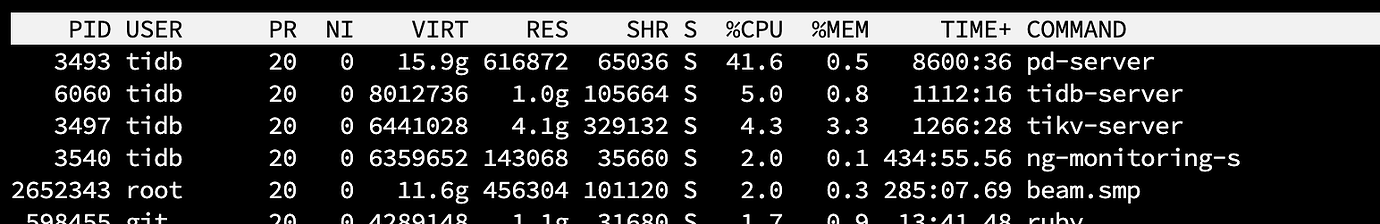
I found that TiDB’s memory usage is relatively high.
I want to turn off some less important monitoring components, such as Prometheus and Grafana, and only keep the dashboard that comes with the TiDB cluster. Is this feasible?
I tried to do this by using the command tiup cluster edit-config tidb-test, but after saving, I got the following prompt:
tiup is checking updates for component cluster ...timeout(2s)!
Starting component cluster: /root/.tiup/components/cluster/v1.14.1/tiup-cluster edit-config tidb-test
New topology could not be saved: immutable field changed: removed Monitors.0.Host with value '192.168.0.150', removed Monitors.0.ssh_port with value '22', removed Monitors.0.Port with value '11400', removed Monitors.0.ng_port with value '11480', removed Monitors.0.DeployDir with value '/home/tidb/tidb-deploy/prometheus-11400', removed Monitors.0.DataDir with value '/mnt/filemanage/tidb/tidb-data/prometheus-11400', removed Monitors.0.LogDir with value '/mnt/filemanage/tidb/tidb-deploy/prometheus-11400/log', removed Monitors.0.Arch with value 'amd64', removed Monitors.0.OS with value 'linux'
Do you want to continue editing? [Y/n]: (default=Y)
If you are sure you want to turn off these monitoring components, you can directly scale down. The edit-config cannot directly scale down. If you need these monitoring components in the future, you can scale up again.
Sure, but it’s not recommended. If you want to remove it, then scale in using tiup-cluster-scale-in.
These have little impact on performance. What monitoring would you use if you turned them off?
In that case, if a node goes down, who will proactively send you alerts? You can’t be watching this dashboard 24/7, right? Waking up to see a string of missed alerts feels really frustrating.
Sure, but it’s not recommended.
The test cluster can be removed, but try to keep it in production, as it is the most friendly way for future reviews.
I don’t think it’s necessary to shut it down. If it’s to avoid affecting the performance of the service itself, deploying separately is a good choice.
If resources are not very tight, there’s no need to do this.
These tools are just little helpers for operations and maintenance.
There is no need to turn them off; the benefits of disabling these components are minimal.
If it has reached the point where you want to scale down the monitoring plugins to free up resources, you should actually talk to your boss about adding another server.
Add more memory. Memory is so cheap now~
It may not necessarily be memory; it could also be computing resources.
This is a comprehensive monitoring system. If you don’t use this monitoring, you won’t have clear service data information for TiDB. Moreover, your issue is that TiDB, PD, TiKV, and TiMon are all on one machine? This is inherently unreasonable and will naturally consume a lot of memory. The normal plan should be one machine for TiMon, three machines for TiDB, three machines for PD, and three or more machines for TiKV.
You can directly scale down, but some data on the dashboard is also obtained from Prometheus. If it’s not available, it won’t be displayed.
It is possible, but not recommended. It lacks the means and basis for querying issues.
It is possible to scale down, but it is not highly recommended.
In the test environment, stop it first in case it is needed later. Use tiup cluster stop tidb-test -N xxx.xxx.xxx.xxx:3000 and tiup cluster stop tidb-test -N xxx.xxx.xxx.xxx:9093. You can try shutting down Grafana and Alertmanager, but Prometheus cannot be shut down as the dashboard retrieves data from Prometheus.
Sure, but it’s not recommended 
In a test environment, it doesn’t matter, but in a production environment, it’s better to keep it on. Otherwise, how will the operations team manage?