Note:
This topic has been translated from a Chinese forum by GPT and might contain errors.
Original topic: Cause: java.sql.SQLException: Information schema is out of date: schema failed to update in 1 lease, please make sure TiDB can connect to TiKV
【TiDB Usage Environment】
Production environment with 64-core CPU, 256GB memory, NVMe disk, 10Gb network, two TiKV instances on one machine
【TiDB Version】
v5.4.0
【Encountered Problem】
Information schema is out of date: schema failed to update in 1 lease, please make sure TiDB can connect to TiKV
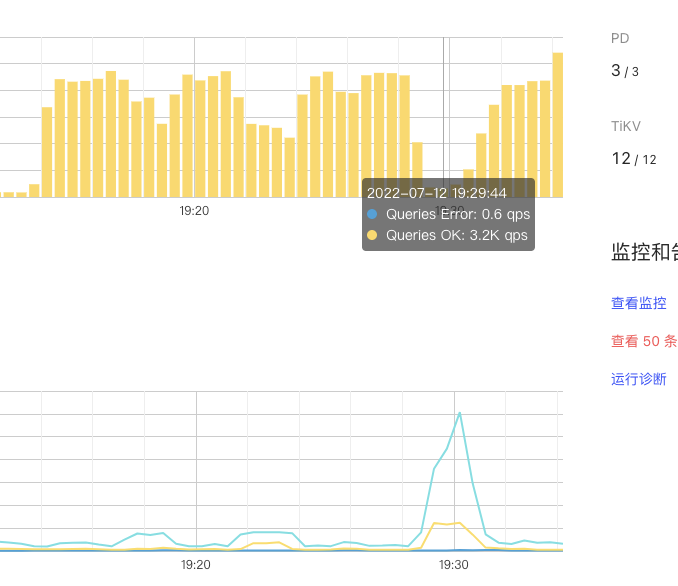
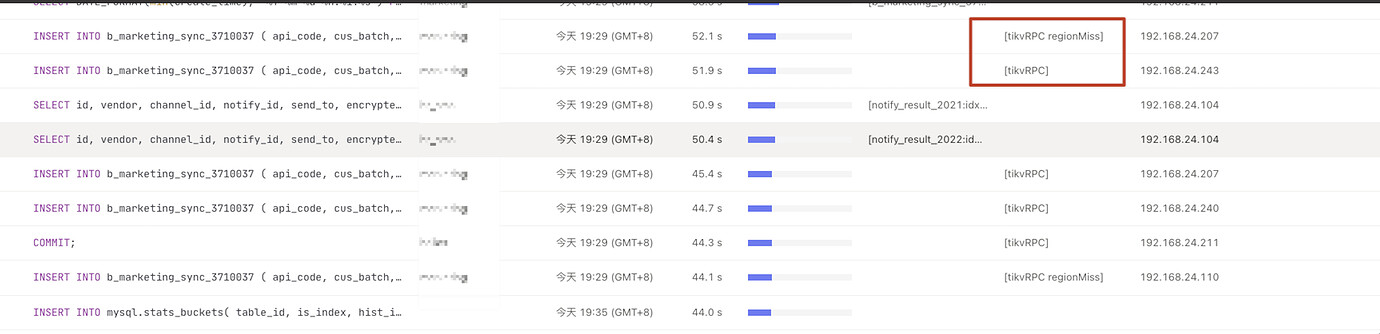
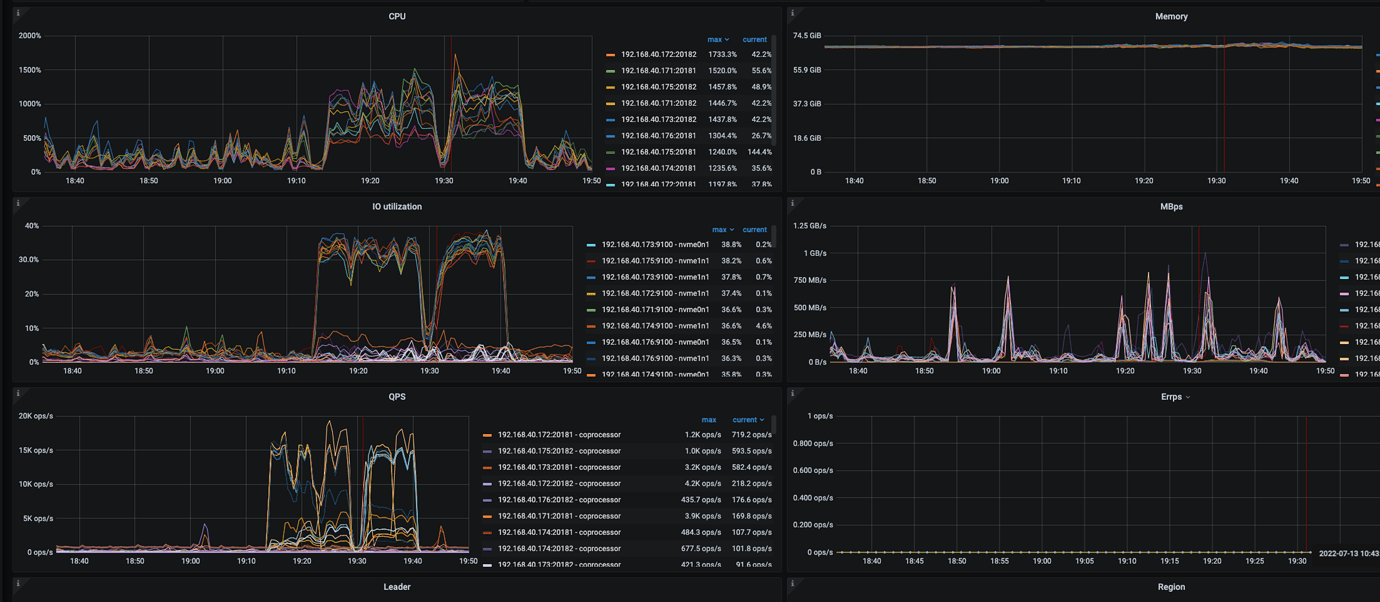
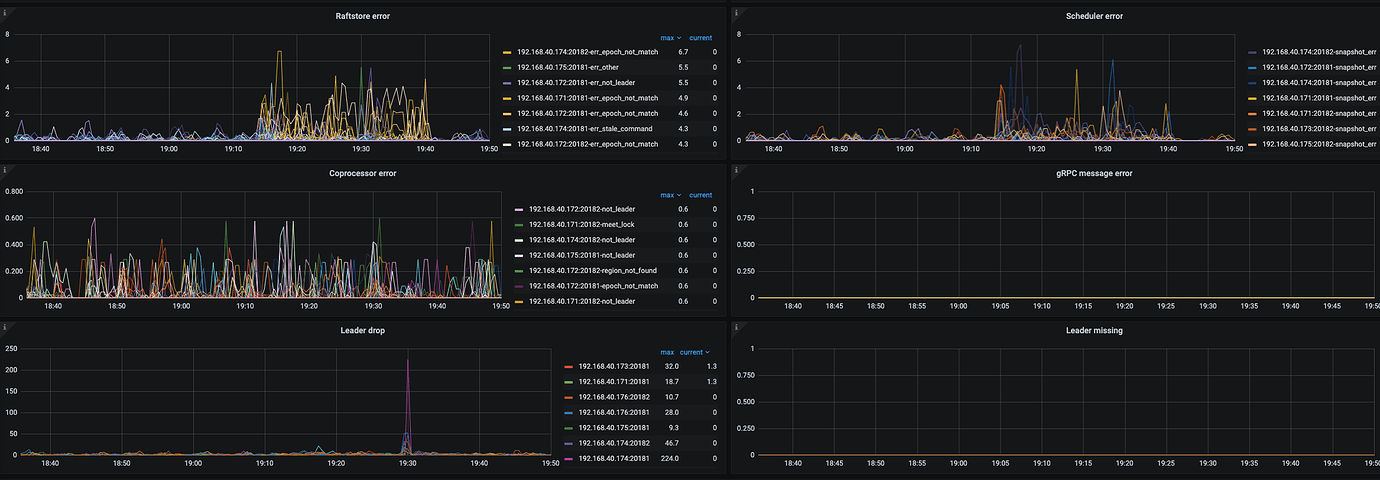
- Around 19:30, the overall system QPS dropped, SQL showed tikvrpc, region miss, and the business side reported the above error. During that time, the leader drop was very high. How to avoid this?
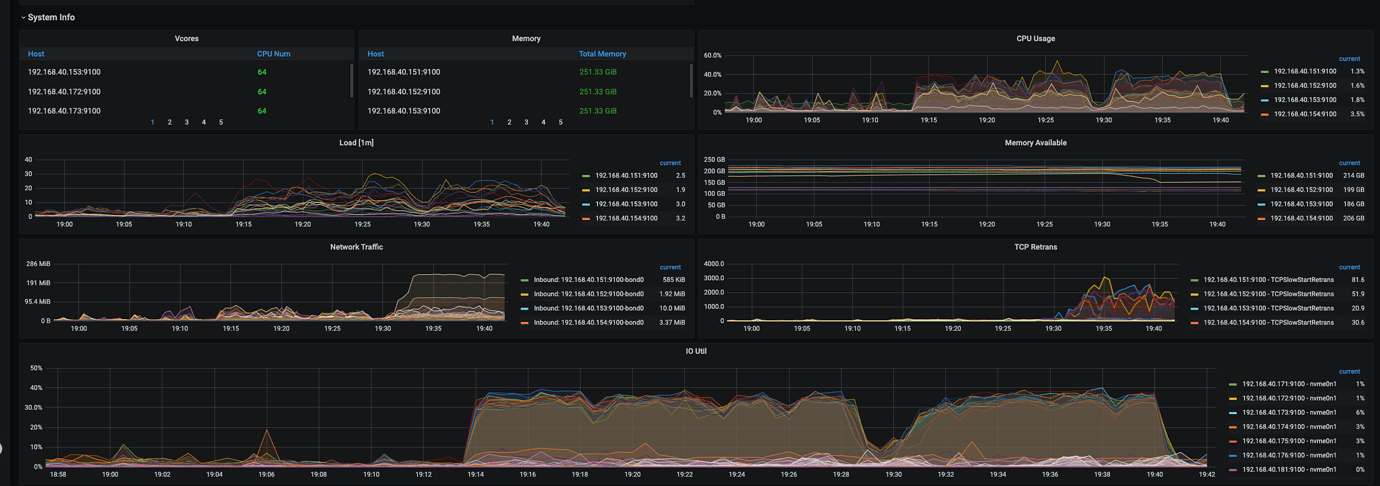
- It was found that the issue was caused by excessive pressure on TiKV, but TiKV’s CPU usage was around 54% and IO usage was around 40%. The business side wants to maintain the current transmission speed. How can TiDB adjust parameters to avoid errors and not affect the business?
【Reproduction Path】
A business table with 160 concurrent operations, inserting 20 million records, with an auto-increment primary key
【Problem Phenomenon and Impact】
- Affects overall stability. When the issue occurs, the response time of the entire system becomes longer.
【Attachments】
Please provide the version information of each component, such as cdc/tikv, which can be obtained by executing cdc version/tikv-server --version.
It is recommended to execute the inserted operations in batches, and the batch size should not be too large.
The pressure on TiKV is not very high, so why can’t we get the Information schema information? Which thread is used to get this information? Can we increase the size of this thread? Also, the leader drop rate is very high, how can we avoid it?
Root Cause Analysis:
- High leader drop indicates that the number of leaders in the raftstore for that store is changing. This change could be due to “continuous hotspot writes caused by auto-incrementing primary keys” or possibly due to heartbeat issues caused by a busy TiKV.
- Region miss-related errors indicate that TiDB is requesting based on the old region leader’s store location cached in the Region Cache, but finds that the leader is no longer there. However, from the provided panel, there doesn’t seem to be a high occurrence of Region Miss. SQL with Region Miss will automatically retry.
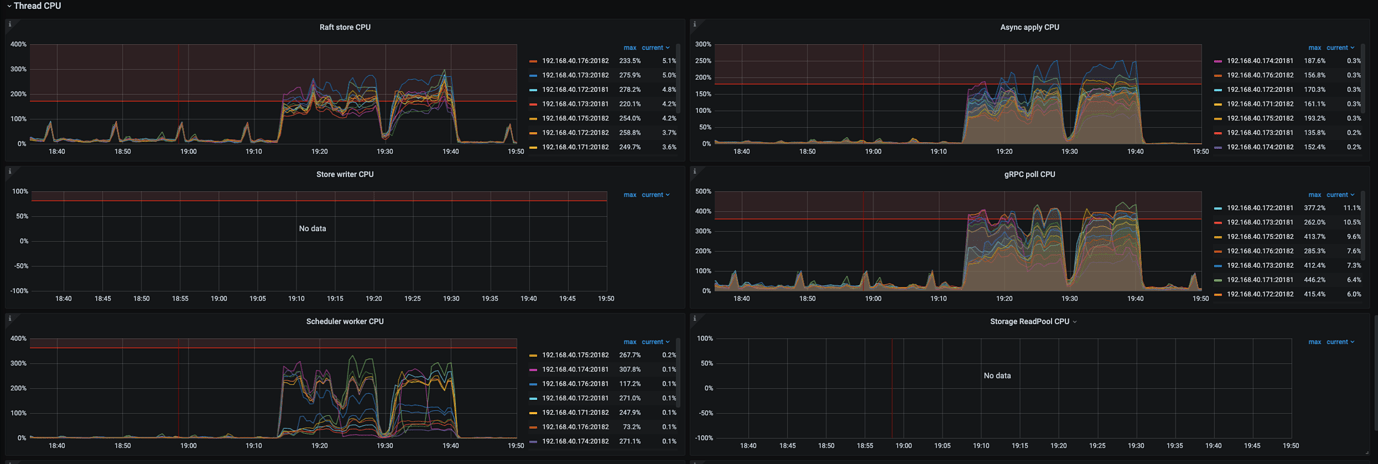
- CPU usage at 54% and IO usage at 40% are not particularly high, but it can be seen that at the time of the leader drop, the raftstore CPU and async apply almost bottomed out. However, before and after the load point, the raftstore CPU and async apply CPU pressure were close to the limit without tuning. This indicates that the current TiKV is under pressure.
Solution (Hypothesis):
- Check if there is a write hotspot on the dashboard for this table. If there is, can the auto-incrementing primary key be changed? For example, using sharding methods to avoid hotspots.
- Check the raftstore store pool size and async apply pool size. Both are set to 2 vCores by default. Since they are nearly maxed out before and after the issue, you can try increasing these thread pools.
Given the limited panel information, it seems that the root cause is more likely due to the pool being maxed out. The high leader count on a single store suggests that continuous auto-incrementing primary keys are causing a write hotspot. If the above attempts do not resolve the issue, you can collect a clinic report, as requesting panels bit by bit is too cumbersome.
Additionally, “Which thread is used to obtain this information? Can it be increased?”
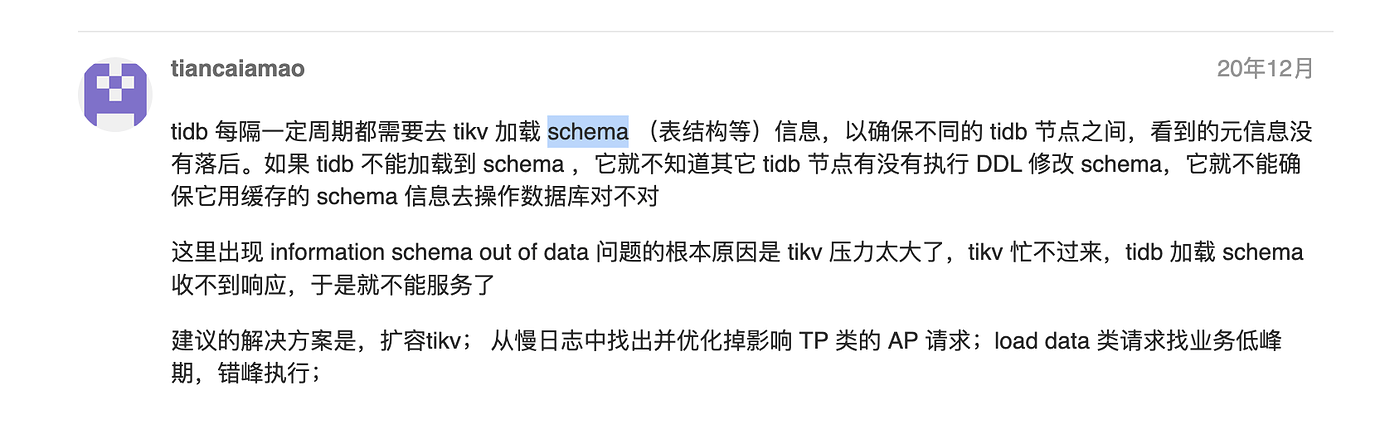
→ The threads used by TiDB to obtain information are sufficient. As maotiancai mentioned, the current issue is that TiKV is under pressure (which cannot be simply judged by system CPU usage). Adding more threads to TiDB won’t help.
It is estimated that a large number of inserts caused region splits, resulting in the client’s cached region information becoming invalid. TiKV is under heavy pressure, with too many heartbeat messages causing timeouts, leading to further batch region timeouts, and all starting elections, which generates even more messages. TiDB cannot read schema information within a certain period. The specific number of regions in your cluster is also unclear.
You can adjust the heartbeat frequency of the region: TiKV 配置文件描述 | PingCAP 文档中心
pd-heartbeat-tick-interval
You can also adjust the parameters for region splitting:
split-region-check-tick-interval
- The interval for checking whether a region needs to be split, 0 means it is not enabled.
- Default value: 10s
- Minimum value: 0
The most fundamental solution is to increase TiKV resources.
This topic was automatically closed 60 days after the last reply. New replies are no longer allowed.