Note:
This topic has been translated from a Chinese forum by GPT and might contain errors.
Original topic: cdc 完成两个tidb之间的同步
[TiDB Usage Environment] Production Environment
[TiDB Version] 7.0.0
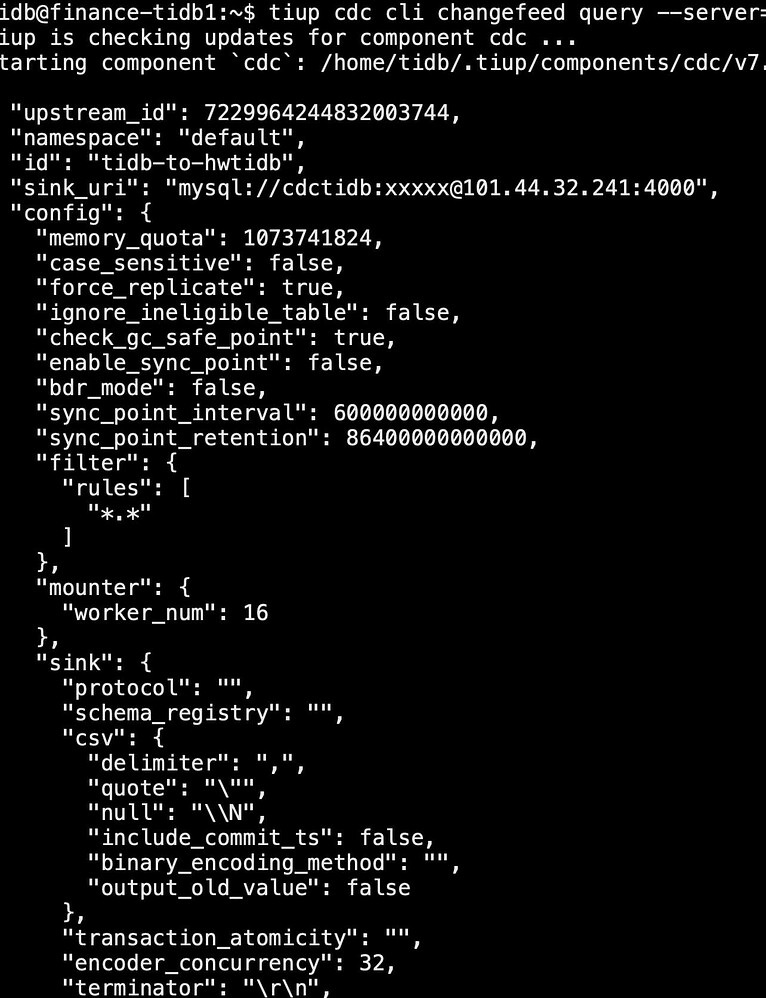
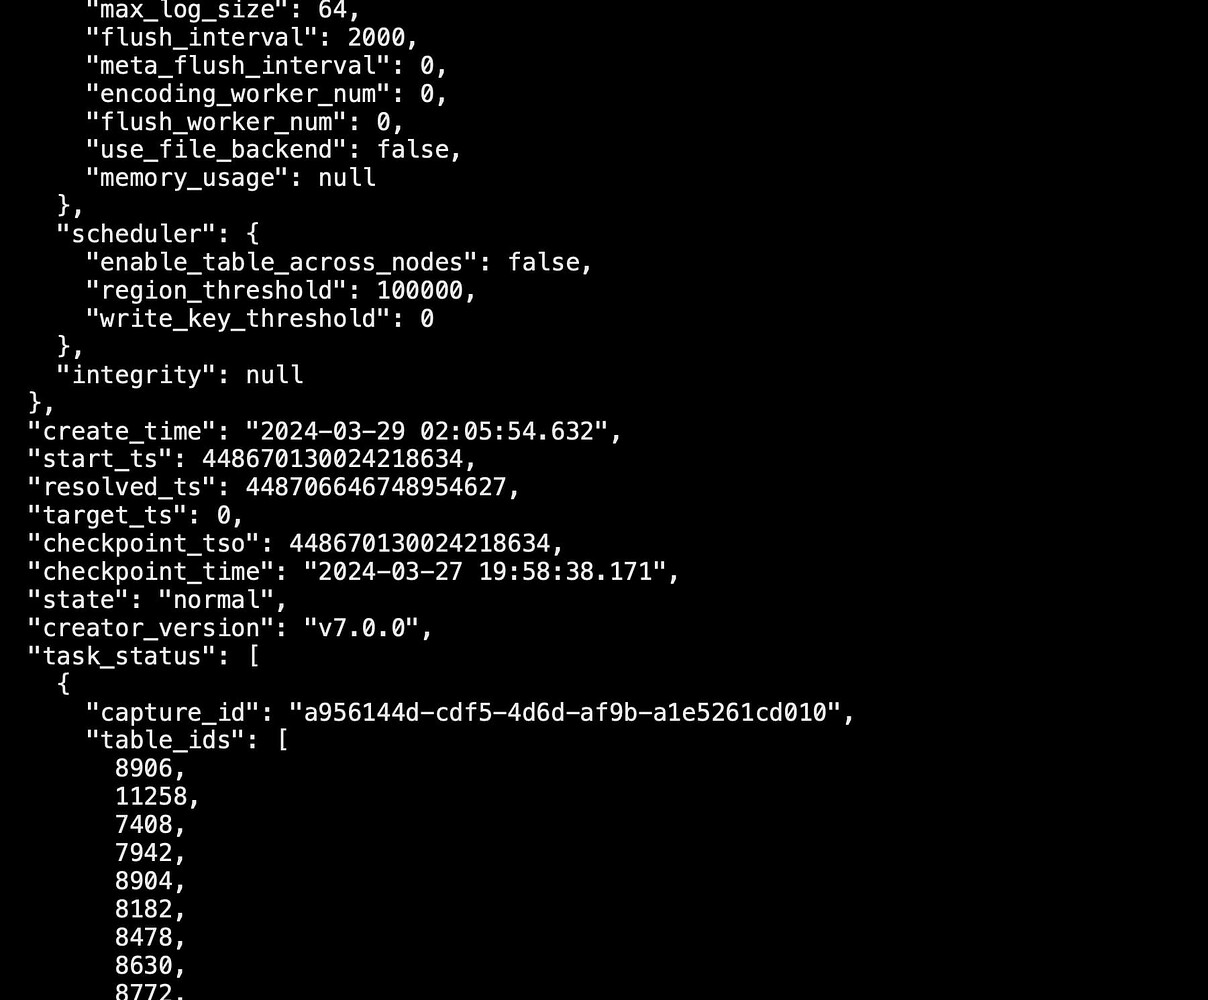
The source TiDB uses tiup br for full backup, with about 1.1T of data on each node. Then, the data is restored on the target (new) TiDB, using CDC to synchronize data from the source TiDB to the target TiDB during the restoration. Currently, there is about a 40-hour lag between the restored TiDB and the source TiDB. After starting the CDC changefeed, all states appear normal, but checkpoint_tso and checkpoint_time remain unchanged, and no table data growth is observed.
[Encountered Problem: Symptoms and Impact]
tiup cdc cli changefeed list
Query Information
Can any expert help take a look? Much appreciated.
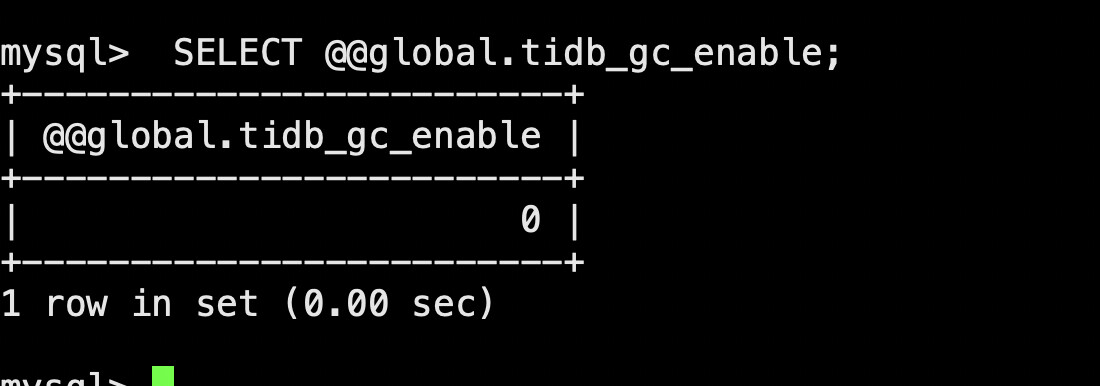
A difference of 40 hours? What is your current cluster GC setting?
I don’t understand which GC setting you are referring to.
When the backup is completed, it prompts [BackupTS=448670130024218634] [RestoreTS=448693405611458561].
I just used BackupTS as the BackupTS for CDC.
If the data volume exceeds 1T, it is recommended to split the larger tables in the database into separate CDC tasks for synchronization, while smaller tables can be merged into a single task for synchronization. This makes it easier to observe and identify which business table is getting stuck during data synchronization.
Additionally, before backing up the primary cluster, you need to adjust the GC time to be as large as possible, for example: 48 hours or 72 hours.
show variables like '%gc%';
Both the source and target TiDB are
When we first started doing master-slave cluster synchronization, we also put everything into one task. When there was a synchronization delay or a stall, the symptoms were very similar to yours.
Later, we split the synchronization into multiple tasks.
When starting TiCDC, there will be an incremental scan process, which is relatively slow. You can check the TiCDC monitoring and observe the resource consumption. If it consumes resources, then there is no problem.
Before the backup, the GC of the source database was turned off.
Your 10-minute GC time is definitely not enough. It is recommended to first extend the GC time, then use the BR tool for backup and recovery, and then create multiple CDC tasks for synchronization.
Before the backup, GC was turned off, and it hasn’t been turned on yet.
When I previously performed master-slave cluster synchronization, I kept GC enabled before and after the backup. It is not recommended to disable GC.
I suggest you first check the logs on each TiCDC node to see what the situation is.
Take a look at the TiCDC monitoring dashboard.
For 1.1T of data, the time required for backup and recovery is approximately how long? You need to reserve this time, which is the size of the GC setting. Or, it is better to set it slightly larger, such as 24 hours or 48 hours. After a full recovery, only incremental data needs to be caught up, which should be very quick. Unless there are large transactions or large-scale data change operations at that time.
We also enable GC for master-slave replication, increase the GC, and use dumpling + lightning for importing.
Later, the expanded CDC was added to the cluster without deploying a separate CDC monitoring node.
Check the monitoring at this location: tikv-details > gc > tikv auto gc savepoint
At present, it seems to be the case. Checking the logs, it looks like it is tracking table by table. Then, according to the corresponding table ID, the data is increasing and being synchronized.