Note:
This topic has been translated from a Chinese forum by GPT and might contain errors.
Original topic: cdc_processor_checkpoint_tso_no_change_for_1m 一直报警 一会 Resolved 一会 Firing
【 TiDB Environment 】Production Environment
【 TiDB Version 】v6.1.1
【 Reproduction Path 】None
【 Encountered Problem: Phenomenon and Impact 】
[1] Firing
Labels
alertname = cdc_processor_checkpoint_tso_no_change_for_1m
It gets resolved for a while and then fires again, constantly alerting every few minutes.
【 Resource Configuration 】
【 Attachments: Screenshots/Logs/Monitoring 】
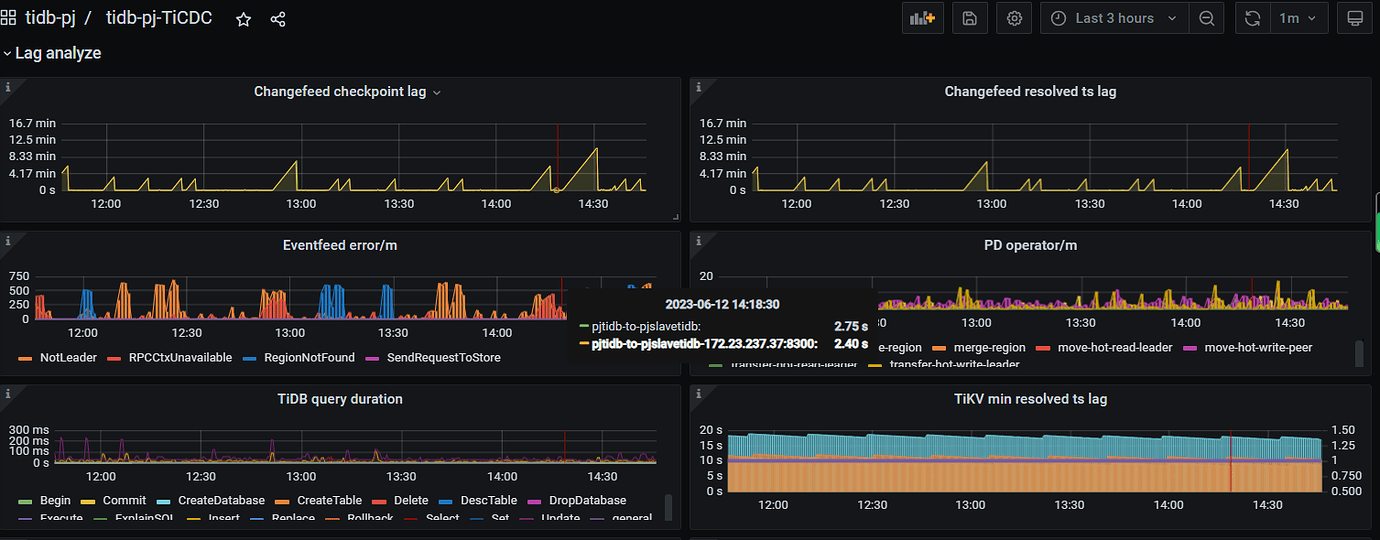
Checking the ticdc lag monitoring, the Changefeed checkpoint lag and Changefeed resolved ts lag have been intermittent for quite a long time.
I observed that when deploying CDC separately on a machine with 8 cores and 16GB of RAM, the CPU usage occasionally spikes but doesn’t reach its limit, and the memory usage is around half.
Based on your description, the issue might be due to the TiCDC checkpoint TSO not changing. TiCDC periodically records the checkpoint TSO for recovering synchronization tasks. If the checkpoint TSO does not change, it may cause synchronization tasks to fail.
To resolve this issue, check whether TiCDC’s synchronization tasks and monitoring metrics are normal. You can follow these steps:
-
Check if TiCDC’s synchronization tasks are normal. You can use TiCDC’s command-line tool tiup ctl or the PD monitoring panel to view the status of TiCDC’s synchronization tasks. If the synchronization task status is normal, you can rule out issues caused by abnormal synchronization tasks.
-
Check if TiCDC’s monitoring metrics are normal. You can use TiCDC’s monitoring panel or Grafana to monitor TiCDC’s metrics, such as checkpoint TSO and resolved TS, to see if there are any abnormal fluctuations or persistent issues.
-
If TiCDC’s monitoring metrics are abnormal, try restarting the TiCDC node or using TiCDC’s dynamic parameter adjustment feature to gradually adjust parameters and observe if the monitoring metrics return to normal.
-
If TiCDC’s monitoring metrics are normal but there are still alerts, try adjusting the alert rules, such as changing the alert threshold or the alert interval, to reduce false positives.
Note that TiCDC’s synchronization tasks are complex and require specific analysis and resolution based on the situation. It is recommended to back up your data before resolving the issue to prevent data loss. Additionally, when deploying TiCDC, set its parameters reasonably based on actual business conditions and hardware configurations to avoid issues with synchronization tasks or monitoring metrics.
Refer to the official configuration requirements~
I see that the load on my CDC machine is not high, with CPU and memory usage not even reaching half.
Please also post the monitoring items for dataflow for the corresponding time period, including the metrics for puller, sorter, and sink output events/s.
This topic was automatically closed 60 days after the last reply. New replies are no longer allowed.