Note:
This topic has been translated from a Chinese forum by GPT and might contain errors.
Original topic: 集群突然响应变慢
[TiDB Usage Environment] Production Environment
[TiDB Version] v4.0.16
[Encountered Problem: Phenomenon and Impact]
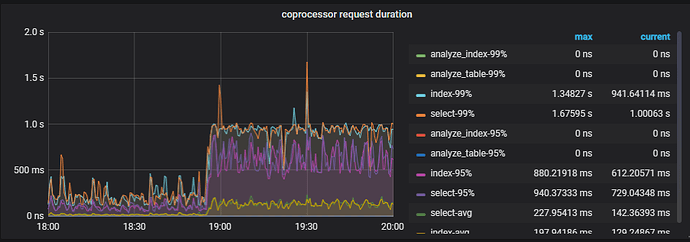
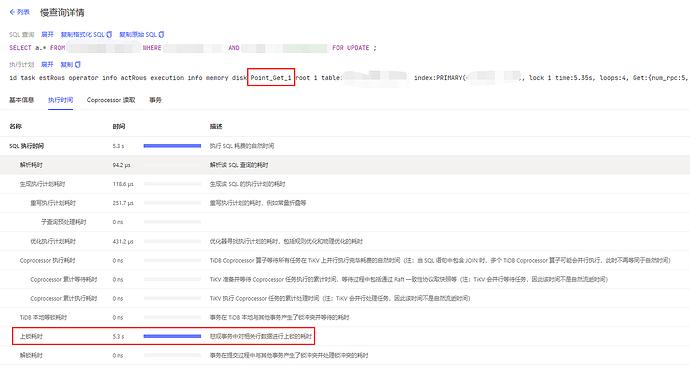
At 19:00 on the 23rd, the system suddenly slowed down. Point_Get took several seconds.
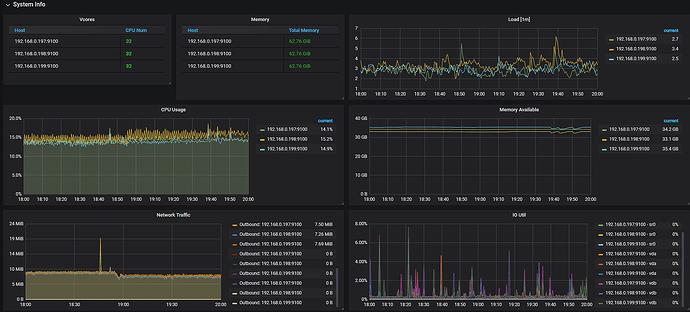
Checked server resource status: IO, memory, and CPU were normal, but Duration significantly increased, and network traffic was maxed out.
Checked the hotspot traffic graph, no hotspots were found. GC time is 10 minutes.
Checked slow queries, no obvious slow queries were found, only that locking time was relatively high.
How should this situation be analyzed?
[Resource Configuration]
Three-node mixed deployment, gigabit bandwidth, mechanical hard drive, hyper-converged
[Attachments: Screenshots/Logs/Monitoring]
The transaction has slowed down, and locking is slow, right?
I feel it’s due to resource contention, with some waiting situations…
Refer to the previous post:
Is the “for update” statement newly introduced? I can’t believe people are still using “for update” nowadays. I thought it was very rarely used.
Resource contention? The memory, CPU, and IO all seem normal. Which chart can further confirm this?
No, the same data is being processed by multiple requests simultaneously, but only one can acquire the lock, while the others are in a waiting state.
Only after the one holding the lock completes the operation can the others acquire the lock…
During this period, there will be a waiting time.
It seems like there is such a possibility.
This time, there are still only 6 hours of historical records, and the corresponding information was not obtained.
Frequent updates with high concurrency?
The concurrency level shouldn’t be that high.
This topic was automatically closed 60 days after the last reply. New replies are no longer allowed.


