Note:
This topic has been translated from a Chinese forum by GPT and might contain errors.Original topic: 不同版本tiup配置monitoring_servers promethus中的additional_arg
[TiDB Usage Environment] Production Environment / Testing / Poc
[TiDB Version]
[Reproduction Path] What operations were performed when the issue occurred
[Encountered Issue: Issue Phenomenon and Impact]
[Resource Configuration] Go to TiDB Dashboard - Cluster Info - Hosts and take a screenshot of this page
[Attachments: Screenshots/Logs/Monitoring]
TiUP Deployment TiDB Cluster Topology File Configuration | PingCAP Documentation Center
TiUP has been upgraded to the latest v1.15.2 and failed to modify on TiDB 7.1.3:
[tidb@tidbtest bin]$ ./tiup cluster edit-config tidb-test
New topology could not be saved: Failed to parse topology file: yaml: unmarshal errors:
line 134: field additional_args not found in type spec.PrometheusSpec
Do you want to continue editing? [Y/n]: (default=Y) n
It can be successfully modified on TiDB version 8.0:
additional_args:
- –web.enable-lifecycle
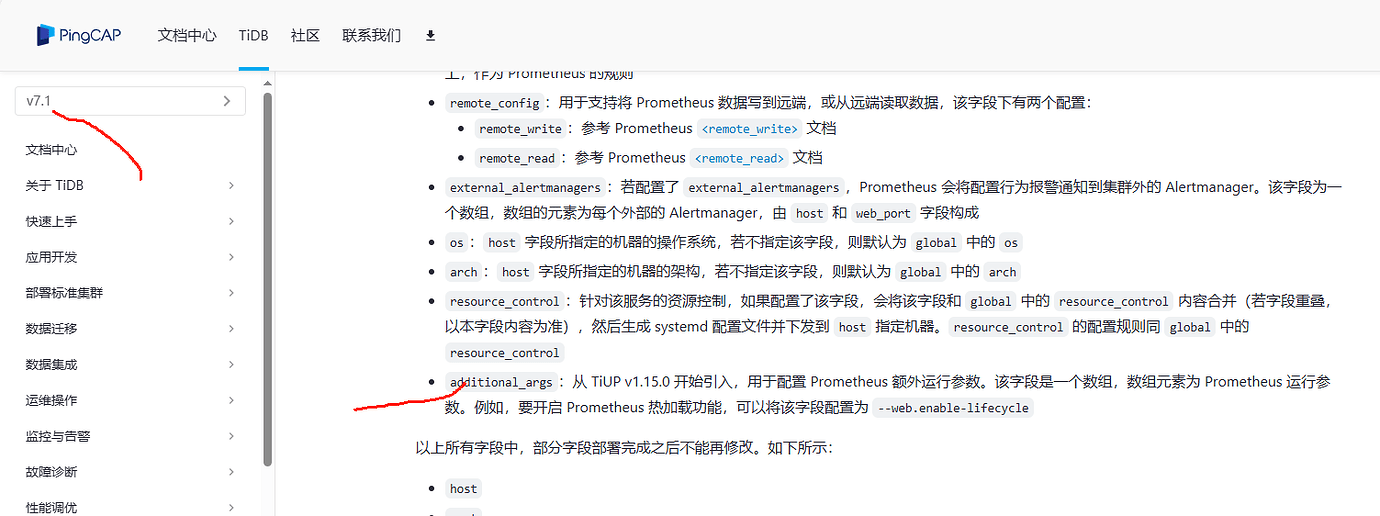
In the documentation for each version, this parameter is sometimes present and sometimes not. It is present in version 7.1, so should it normally be usable?