Constantly getting "connection reset by peer" for TiKV -> TiFlash connection

I am constantly getting “connection reset by peer” for a query that uses TiFlash.
I run this query around 3 times every hour as a cron job, and often times I encounter this error in my error monitoring tool along with the job failing.

When I run it manually it usually takes from 100~300ms.
But sometimes when the job fails it shows up in the slow queries section and one recent fail took 11 sec according to it.

The table in question is setup to work with 2 replicas of TiFlash.
And a quick check to information_schema.tiflash_replica says that it’s available (AVAILABLE: 1, PROGRESS: 1).

The table is indexed, but since it’s being executed by TiFlash it does a full scan to the currently 15973 total number of records (which is not really “a lot”).

Also it took around 247 ms for a simple COUNT to the table in question.
I thought it would be a bit more faster to run COUNT on a table with just 15973 rows in TiFlash.
A EXPLAIN ANALYZE in Chat2Query shows that the execution time for the COUNT was about 123.8 ms (a more realistic number).
But the Query Log shows that the total duration for the query was higher (247ms, notice it’s almost about 123.8 * 2 for some reason).
It shows similar numbers in repeated executions.

Does it have to do with locations maybe?
Do I have to specify the TiFlash replica location to be the same as the TiDB cluster region?
How can I check where are the TiFlash replicas? information_schema.tiflash_replica shows nothing.
I couldn’t find much information on that, specially for TiDB cloud serverless.

Application environment:

TiDB Cloud serverless tier (production)

TiDB version:

v7.1.1

Reproduction method:

This is the query I’m running.
Which is just getting the top 200 scores from a table.

SELECT
  *
FROM
  `title_user_score`
WHERE
  `title_user_score`.`title_score_id` = ?
  AND `title_user_score`.`score` > ?
ORDER BY
  `title_user_score`.`score` DESC
LIMIT
  ?;

Problem:

Getting this kind of error:

error returned from database: 1105 (HY000): rpc error: code = Unavailable desc = error reading from server: read tcp 10.0.109.108:50028->10.0.113.162:3930: read: connection reset by peer

Attachment:

One of the recent slow queries.
Query Time 11.0 s
(everything else is in µs or ns, and most of them are 0, which shows it’s some connection problem rather than a bad optimized query)

Is Success? No

Max Memory 4.9 KiB

Plan

id task estRows operator info actRows execution info memory disk
TopN_10 root 100 ca_server_db.title_user_score.score:desc, offset:0, count:100 0 time:10.8s, loops:1 0 Bytes N/A
└─TableReader_22 root 100 MppVersion: 1, data:ExchangeSender_21 0 time:10.8s, loops:1 4.87 KB N/A
└─ExchangeSender_21 cop[tiflash] 100 ExchangeType: PassThrough 0 N/A N/A
└─TopN_20 cop[tiflash] 100 ca_server_db.title_user_score.score:desc, offset:0, count:100 0 N/A N/A
└─Selection_19 cop[tiflash] 7539.86 gt(ca_server_db.title_user_score.score, 0) 0 N/A N/A
└─TableFullScan_18 cop[tiflash] 7539.86 table:title_user_score, pushed down filter:eq(ca_server_db.title_user_score.title_score_id, 1), keep order:false 0 N/A N/A

Based on the information you provided, it seems like you are encountering a “connection reset by peer” error for a query that uses TiFlash in your TiDB Cloud serverless environment. This error can occur due to various reasons, such as network issues, TiFlash replication problems, or configuration issues. Let’s troubleshoot this step by step based on the official documentation:

  1. Check TiFlash Replicas:

    • First, ensure that TiFlash replicas have been created successfully. You can run the SELECT * FROM information_schema.tiflash_replica command to check the status of TiFlash replicas .
    • Verify that the TiFlash replication is running correctly by checking the progress in the logs. If there are any abnormalities in the replication, it may cause issues with the TiFlash connection .
  2. TiFlash Replication Location:

    • It’s essential to ensure that the TiFlash replica location is properly configured and aligned with the TiDB cluster region. While TiDB Cloud handles the infrastructure, understanding the location of TiFlash replicas can help in diagnosing any potential issues .
  3. Query Performance:

    • The performance of your query can be impacted by various factors, including the number of records, indexing, and network latency. Since TiFlash executes the query, it’s crucial to optimize the query for efficient execution.
    • You mentioned that the query sometimes takes longer than expected. It’s recommended to analyze the query plan and execution details to identify any bottlenecks or inefficiencies .
  4. Network and Connection:

    • The “connection reset by peer” error can also indicate network or connection problems. Ensure that there are no network issues between TiKV and TiFlash nodes that could lead to connection disruptions.
    • Monitoring the network traffic and checking for any potential network congestion or latency issues can help in diagnosing connection problems.

In conclusion, to address the “connection reset by peer” error for your TiKV → TiFlash connection in TiDB Cloud, you should verify the status of TiFlash replicas, ensure proper configuration alignment, optimize query performance, and investigate any network or connection issues. By following these steps and monitoring the system closely, you can troubleshoot and resolve the connectivity issues you are facing.

Do you still get the “connection reset by peer” error, and could you tell me the region where your cluster is located?

As far as I know, the ap-northeast-1 region suffered a 10-minute outage yesterday, but it should be working fine now.

https://status.tidbcloud.com/796339428#logs

No

TIDB Serverless’s Tiflash nodes and TIDB nodes are under the same region.

1 Like

Thank you for checking and for the responses.

My cluster is indeed located in ap-northeast-1.

I can confirm that many other queries failed during the outrage yesterday, but the one I posted doesn’t seem to relate to this outrage.

In fact the above error was reproduced today and two days ago:
UTC 2024-03-06 01:11:52
UTC 2024-03-04 04:03:42
matching with my error monitoring logs and also the slow query results in the TiDB dashboard.

And the following from only error monitoring logs (since the TiDB dashboard only shows the slow queries from the last 3 days)
all UTC:
Mar 2, 2024 1:02:25 PM
Mar 1, 2024 1:02:26 PM
Mar 1, 2024 5:02:58 AM
Feb 29, 2024 9:02:27 AM
Feb 29, 2024 6:02:44 AM
Feb 28, 2024 11:02:43 PM
Feb 28, 2024 2:03:46 PM
all corresponding to “connection reset by peer” errors.

Not sure if it’s related but other TiKV queries (tables with no TiFlash replica set up) also get affected sometimes.
For a really simple indexed query that usually takes about 15 ms,
in bad occasions it happens to take > 300ms, making it appear in the slow queries section.
and all I can see is for example:
Query Time 317.7 ms
and the other values really low as usual.
This query is the one with most executions because it’s the auth part of my service.

So there is a time period or a spontaneous number of requests that become really slow for an unknown reason.

Not exactly sure if that’s how TiDB works by design or not.
I’m aware that because of how it’s structured and implemented to achieve HA, it has higher latency than a plain MySQL setup but I didn’t know it could periodically get this high numbers for simple queries.
I really enjoy using TiDB so I hope it can be improved somehow.

Thanks for your feedback, and sorry to bring trouble to your application.

I have forwarded the relevant issues with TiFlash to the engineering team, and they have preliminarily identified the cause of the error, but this may require some hotfix and test work. Once there is a result, I will synchronize here.

1 Like

Maybe you can find the actual parameter values in SQL from the execution plan of Slow Query for confirmation. In some cases, because the parameter value is different, the query may need to load more data (Check the actRows of the TableRowIDScan in the explain plan) from the disk than usual.

Please also check: EXPLAIN Walkthrough | PingCAP Docs

Thank you very much.
I will be waiting for the hotfix.

As for the other slow query,
I see that it’s not one parameter presenting the problem every time, but rather a certain (very short) period of time with slow queries.

This is for example one of the them (notice the 454 ms duration, and it’s just a table with 10000 records):

id task estRows operator info actRows execution info memory disk
Point_Get_1 root 1 table:user, index:firebase_uuid_index(firebase_uuid) 1 time:454.9ms, loops:2, Get:{num_rpc:2, total_time:454.8ms}, scan_detail: {total_process_keys: 2, total_process_keys_size: 182, total_keys: 2, rocksdb: {block: {}}} N/A N/A

Seems to be indexed, and the data size is minimal because it’s a really simple table/query (it’s just an AUTO_RANDOM unsigned bigint id and string uuid) with not so many records.

As far as I can see it happens about 1 to 4 times a day.
I cannot say in detail the load (req/min) I’m getting but it’s not anything extraordinary, so I personally find it presenting kind of frequently.

but rather a certain (very short) period of time with slow queries.
As far as I can see it happens about 1 to 4 times a day.

Could you also list the time period when the query slows down? In these time periods, will your application perform other heavy queries?

Sure, I will only list the ones that match with my previous explanation (the simple query one), here they are:
2024-03-06 23:57:41
2024-03-06 23:07:06
2024-03-06 22:00:07
2024-03-06 21:40:13
2024-03-06 04:50:09
2024-03-06 04:41:09
2024-03-05 18:40:11

Not in this sample, but in previous days there were almost consecutive (in the same or in the next second) queries being slowed down, thus I thought it was a “time period”.

The only really “heavy” query I am executing is the one I mentioned in the beginning, which runs 3 times every hour, lasting just a couple of seconds. So only two of the above timestamps matches that time period.

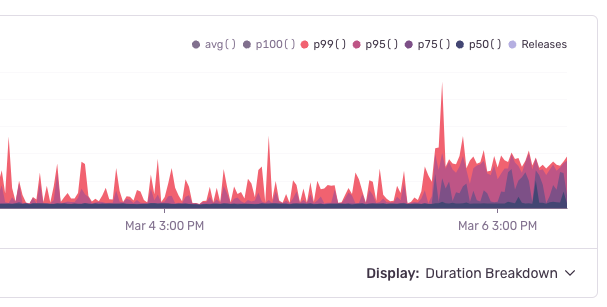
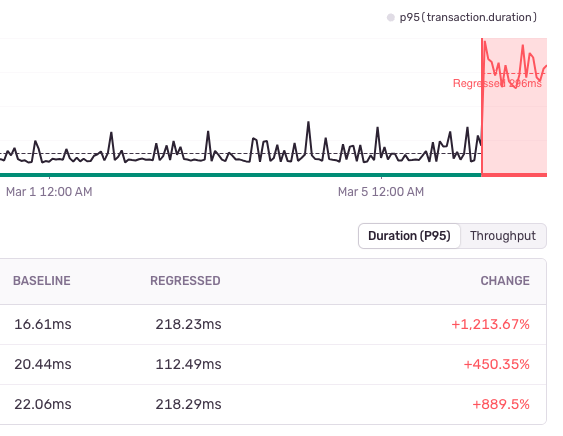
Also it is worth mentioning too, that in my error monitoring tool (Sentry) I also track performance,
and for some reason since yesterday a lot of queries were slower than usual.
The overall duration started to be slower than usual from around 2024-03-06 05:00 AM UTC.
The load (user count, request count) since then hasn’t changed much.
Screenshot 2024-03-07 at 10.13.13
Screenshot 2024-03-07 at 10.15.37

In the second screenshot the described “regressed” records are pointing to some queries for a specific endpoint I have. The endpoint doesn’t do anything but auth and logging so I can say for sure that it’s not about the API server process taking longer.
Some of my other endpoints are also presenting the same trends since the same time period.

I cannot say for sure that it’s not about the connection between my API server and TiDB cluster (different services, different infrastructure, but same region). But since the Slow Query page in the TiDB dashboard also shows more occurrences since that time, I suspect it’s really the queries taking longer.

@riverreal Hi, from the message provided by the core team, region ap-northeast has completed the upgrade of TiFlash from 7.4 to 7.5, and contains hotfix for previous TiFlash problems.

I will inform you here if it still reproduces.
Thank you very much.

1 Like