Note:
This topic has been translated from a Chinese forum by GPT and might contain errors.
Original topic: 请教一下TiDB_monitor_time_jump_back_error 的单位
Could you please tell me the unit of the monitoring item TiDB_monitor_time_jump_back_error?
The official documentation does not clearly state the unit of this value.
By default, it triggers an alert if it is greater than 0.
Is it recommended to adjust this value, for example, to 1.5 or 2 in certain scenarios?
Understood. Please provide the Chinese text you need translated.
The version 6.1 I checked does not have this metric. This should refer to the metric: tidb_monitor_time_jump_back_total.
Looking at the code definition corresponding to this metric:
TimeJumpBackCounter = prometheus.NewCounter(
    prometheus.CounterOpts{
        Namespace: "tidb",
        Subsystem: "monitor",
        Name:      "time_jump_back_total",
        Help:      "Counter of system time jumps backward.",
    })
It means: Counter of system time jumps backward.
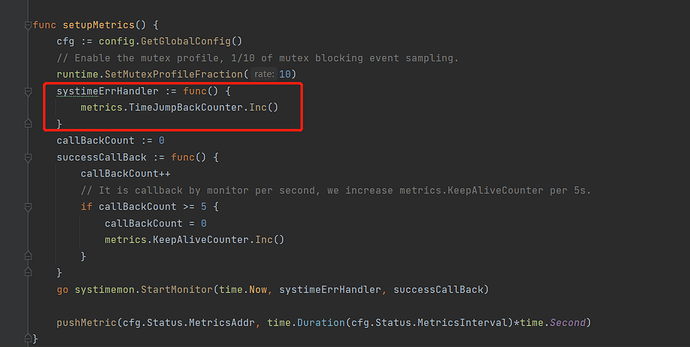
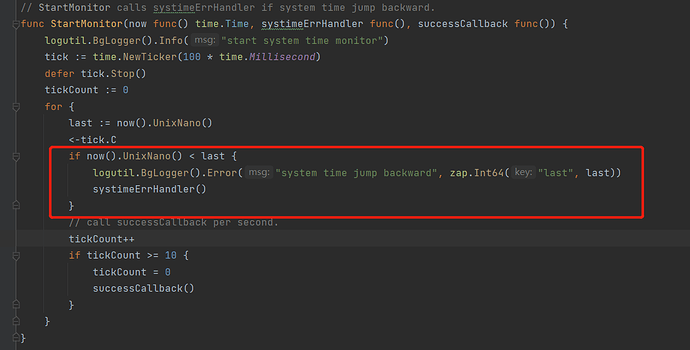
Looking at the metric’s instrumentation:
The code clearly states that it checks every 100 milliseconds. If it detects that your system time has been adjusted backward (slowed down by more than 100ms), then the tidb_monitor_time_jump_back_total metric will increment by 1.
Therefore, as long as the time > 0, it is fine to alert without any other adjustments.
However, I have a question here: if using clock synchronization, the current machine’s time speeds up and needs to be adjusted back by more than 100ms, how can this alert be resolved?
The description seems very clear. If there is a time difference on the machine within 10 minutes, an error will be reported.

