Continued Discussion on OOM After Upgrading TiDB

Note:
This topic has been translated from a Chinese forum by GPT and might contain errors.

Original topic: 升级 tidb 后OOM 延续讨论

| username: jianzhiyao

Continuing the discussion from OOM after upgrading TiDB (4.0 → 5.3.1):

It was running normally all along, and then it suddenly happened.

Previously, as suggested, I had already changed the version to 1 and deleted the statistics information.

| username: xfworld | Original post link

What is the current situation?

| username: jianzhiyao | Original post link

Last time, according to the post, I changed the version to 1, but after running for a while, it still resulted in OOM. So, I’m a bit confused and almost in a state of giving up. I wanted to come here to seek some knowledge.

| username: h5n1 | Original post link

Check the high cop task and the large data volume SQL during that period.

| username: xfworld | Original post link

Check the slow SQL or large transactions’ SQL to locate the issue…

See which operations are causing the OOM.

| username: jianzhiyao | Original post link

Report of the fault period

| username: h5n1 | Original post link

Is there a sort by memory option?

| username: jianzhiyao | Original post link

It seems that there isn’t any. Our business doesn’t have order by type statements.

| username: h5n1 | Original post link

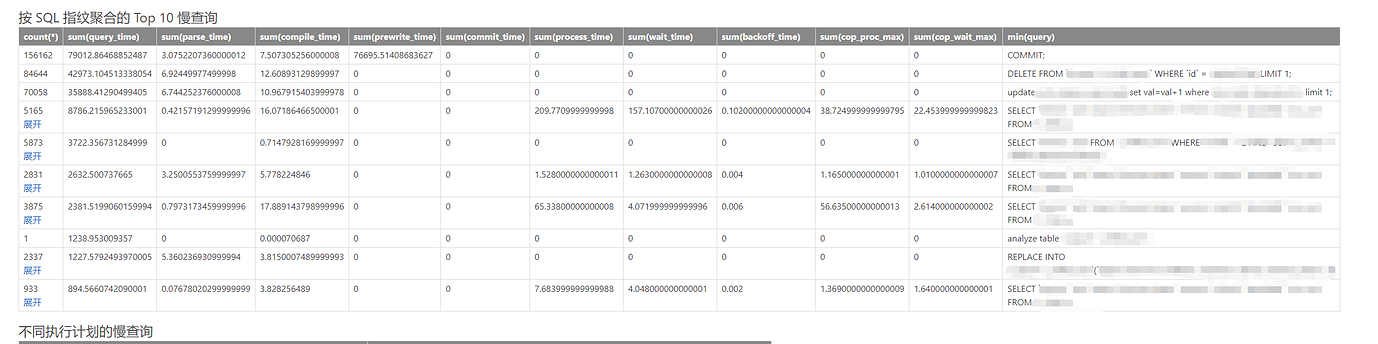
You can check CLUSTER_STATEMENTS_SUMMARY_HISTORY or CLUSTER_SLOW_QUERY to see the SQL statements with high memory usage before the OOM by summing up the MAX_MEM.

| username: XiaojuWu | Original post link

You can get the heap profile information before OOM by searching “tidb-server has the risk of OOM. Running SQLs and heap profile will be recorded in record path” in the log.

| username: system | Original post link

This topic was automatically closed 60 days after the last reply. New replies are no longer allowed.