Note:
This topic has been translated from a Chinese forum by GPT and might contain errors.
Original topic: Dashboard 概况显示不完整
[TiDB Usage Environment] Production, Testing, Research
Testing
[TiDB Version]
Community Edition v6.1.0
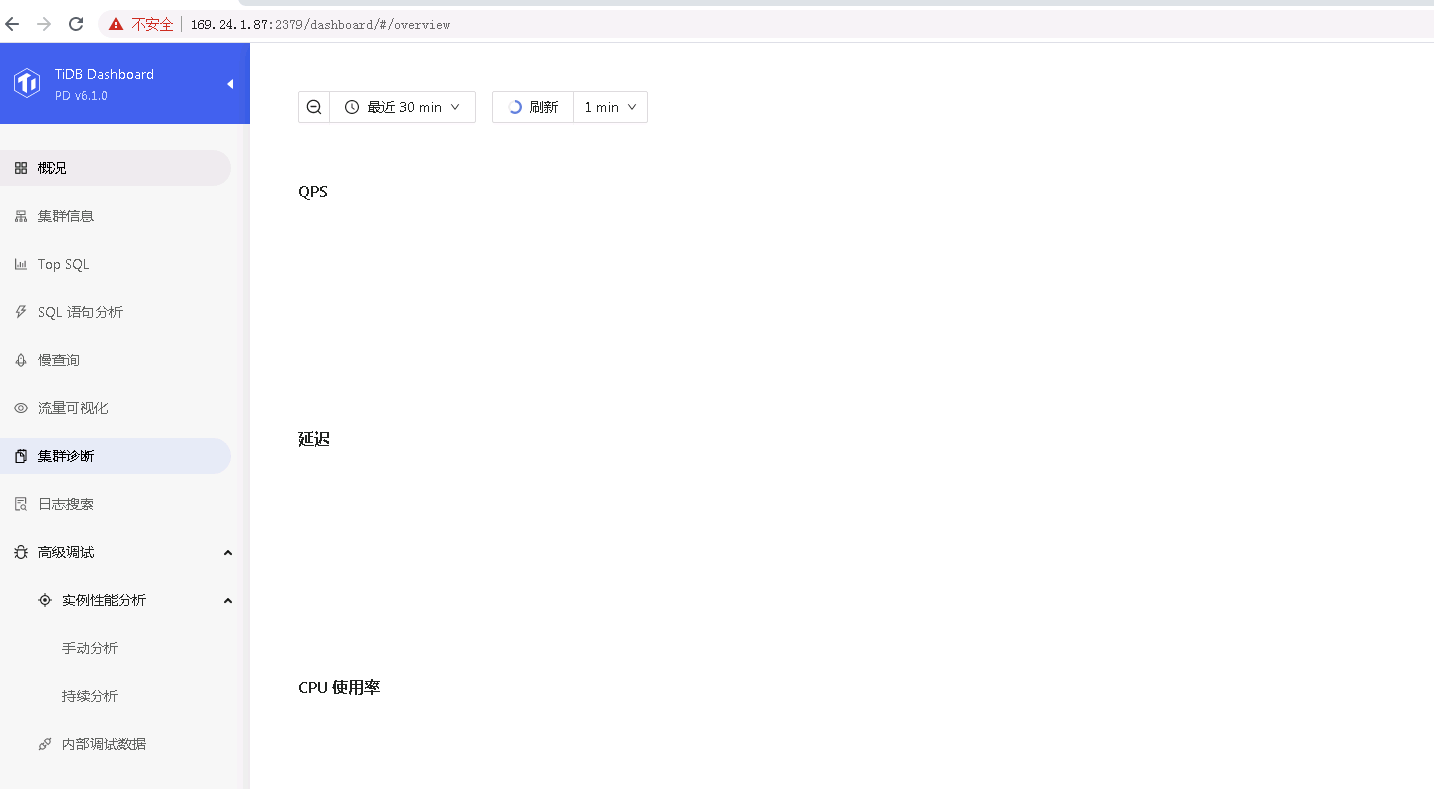
[Encountered Problem]
[Reproduction Path]
What operations were performed to encounter the problem
[Problem Phenomenon and Impact]
[Attachment]
Please provide the version information of each component, such as cdc/tikv, which can be obtained by executing cdc version/tikv-server --version.
Your page is probably stuck.
The page is not stuck, and the same effect occurs on two different machines. Upgraded from 5.3 to v6.1.0 today and found it not working well, whereas it was working fine with 5.3 before.
Are all the network ports open? Try turning off the firewall and similar settings.
Try changing the browser or restarting the PD’s UI.
Sorry, when you mention restarting the PD UI, do you mean restarting the dashboard? How do you restart it?
Check the Status for the one marked as Up|UI, and try restarting this PD node.
You can try switching to a different browser, such as a higher version of Google Chrome or 360 Browser.
It could be a browser version issue.
Using Google Chrome might be better.
After clearing the cache, reopen it or switch to a different browser.
Check if SELinux is disabled?
Confirm whether the PD service is functioning properly, and also ensure that the Prometheus service is running normally. Some of the information on the PD dashboard comes from Prometheus.
SELinux is turned off, thank you.
The status shows everything is normal, and the cluster has also been restarted.
Check the PD logs of the corresponding UI node. Are there any anomalies?
Are there no data on other menu pages as well? It seems like there is no monitoring data. Check your tiup version.
Other menus have data, the tiup version is v1.10.2