Dashboard shows TiKV machine IOPS above 80%

Note:
This topic has been translated from a Chinese forum by GPT and might contain errors.

Original topic: Dashboard显示tikv 机器 IOPS 80%以上

| username: 特雷西-迈克-格雷迪

【TiDB Usage Environment】Production Environment
【TiDB Version】TiDB 6.1.2
【Reproduction Path】What operations were performed when the issue occurred
【Encountered Issue: Issue Phenomenon and Impact】

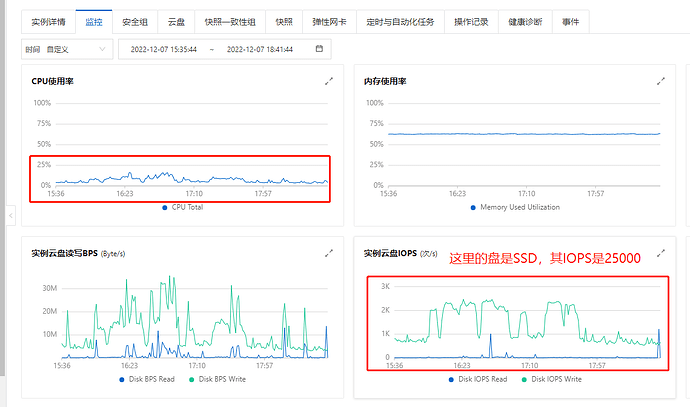
The Dashboard shows that the IOPS of several TiKV machines (Alibaba Cloud ECS) is above 80%, and the CPU also reaches 80%, but the ECS machine monitoring on Alibaba Cloud does not show reaching the bottleneck. I am not sure how the monitoring metrics on the Dashboard are calculated.

【Attachments: Screenshots/Logs/Monitoring】


| username: Billmay表妹 | Original post link

Reply from @tidb狂热爱好者:

IO is taken by the system, there’s an iostat.

| username: dba-kit | Original post link

It depends on which dashboard you are looking at. In many places, it refers to the number of cores rather than the overall CPU utilization.

| username: dba-kit | Original post link

The IO utils in iostat don’t really indicate whether an IO bottleneck can be reached. As far as I remember, it represents how long IO has been running during this period, not just that it is running at such a high IOPS.

| username: 特雷西-迈克-格雷迪 | Original post link

What is the path to the source code? Hehe

| username: system | Original post link

This topic was automatically closed 60 days after the last reply. New replies are no longer allowed.