Note:
This topic has been translated from a Chinese forum by GPT and might contain errors.
Original topic: Dashboard TopSql 模块提示502
[TiDB Usage Environment] Production Environment
[TiDB Version] 6.5.0
[Reproduction Path] Operations performed that led to the issue
[Encountered Issue: Issue Phenomenon and Impact]
The Top SQL module reports a 502 error when clicked. It seems that the /top/instance endpoint directly returns a 502 error. Also, I would like to ask where the DashBoard log directory is located, as I have not been able to find it.
[Resource Configuration]
[Attachments: Screenshots/Logs/Monitoring]
Click on Settings to check,
Relevant documentation can be found at:
To use Top SQL, you need to deploy or upgrade the cluster using TiUP (v1.9.0 and above) or TiDB Operator (v1.3.0 and above). If you have already upgraded the cluster using an older version of TiUP or TiDB Operator, please refer to the FAQ for handling.
Enabling Top SQL will have a slight impact on cluster performance (within an average of 3%), so this feature is disabled by default. You can enable Top SQL using the following methods:
- Visit the Top SQL page.
- Click Open Settings. On the right Settings page, turn on the switch under Enable Feature.
- Click Save.
You can only see the CPU load details after enabling the feature; the CPU load details before enabling the feature cannot be displayed on the interface. Additionally, there is a delay of up to about 1 minute, so you may need to wait a moment to see the data.
Besides using the graphical interface, you can also configure the TiDB system variable tidb_enable_top_sql to enable the Top SQL feature:
SET GLOBAL tidb_enable_top_sql = 1;
Both the cluster and components are the latest versions. Now, clicking into the Top SQL module results in an error, with no other operations performed.
This feature is disabled by default. You can enable Top SQL using the following methods:
- Visit the Top SQL page.
- Click Open Settings. On the right Settings page, toggle the switch under Enable Feature.
- Click Save.
After enabling it, the same error is reported.
Check if ngm has started normally in the deployment node of Prom.
It starts normally, but the ng-monitoring-server status is sleep. In another cluster where the Top SQL feature works fine, this process is also in sleep status.
Try restarting the PD where the Dashboard is located.
Restarting a single PD, reloading or restarting the cluster, and reinstalling after destroying it all couldn’t solve the problem. Initially, I thought it might be an issue with a certain port on the server, but there were no errors during installation. Accessing the Top SQL interface directly through Postman returns a 502 error, but without adding a bearer token, it returns a 401 error, which proves that the request can reach the corresponding server normally. 
Try restarting the Prometheus node.
Can you check the error logs of the PD node you accessed? The PD logs. Please click and take a look.
I tested upgrading from 6.1 to 6.5, and there was no problem. The PD of 6.5 can be used.
I simulated your error. The dashboard address does not have load balancing capability; only one PD node provides this capability. The behavior is: when you access the addresses of 21, 22, and 23 IPs, they will all be forwarded to a single PD node. The Top SQL feature uses an SQLite database, and it is possible that this database has encountered an issue.
Restarting the monitoring machine node and the PD node currently doesn’t help 
I also upgraded from 6.1 to 6.5, and this error still hasn’t been resolved.
It might be this file causing the error. Your machine is a test machine, right??? Not production.
The errors are not quite the same. After you delete the file, there is a communication failure, while in my case, the communication is successful. When simulating the request through Postman without the bearer token, it prompts a 401 error, so the issue should be in the logic behind the interface request (for example, a service might be down, but there is no corresponding ERROR in the logs). I’ll take a look at the dashboard’s source code logic. Thanks for the response. 
In the production environment, it’s just multiple machines simulated by virtual machines. The test cluster, which consists of physical machines, has never encountered this issue.
What I mean is that the dashboard’s functionality is merely for monitoring. Why not remove it and redo it? This kind of distributed database architecture has already achieved high availability.
-
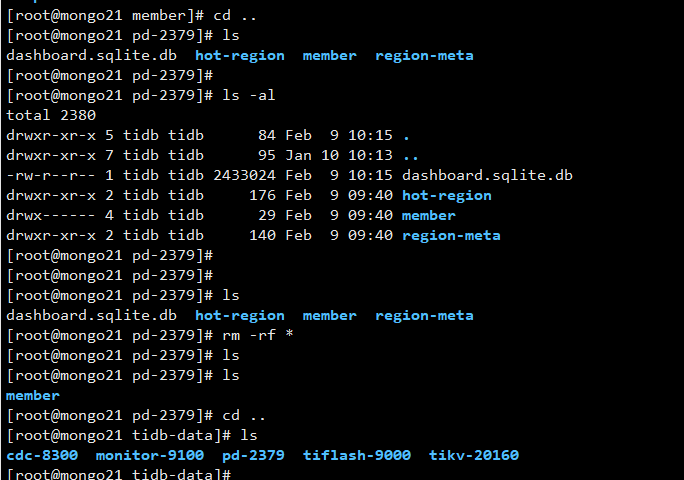
Delete the dashboard’s data files. I deleted all files in the PD data directory. The data files will only exist on one PD node. Different PD access nodes will be redirected to the PD containing the dashboard’s data files.
-
Check the cluster status.
-
Check the dashboard: various errors occur at this point.
-
Remove the faulty node.
tiup cluster scale-in tpln_qa --node 192.168.2.21:2379
-
Wait for the switch.
-
At this point, all dashboard content has switched to the 192.168.2.22 node.
-
Add a new PD node.
Caution: Test in a test environment first before proceeding.
Were you destroying the TiDB cluster at that time?
I tried it, but it’s still reporting a 502 error. Yes, it’s a destroyed cluster. Although it’s a production environment, it hasn’t been integrated into the project yet; it’s still in the deployment and maintenance phase.


