Dashboard User Login Authentication Failed: Authenticate Failed

Note:
This topic has been translated from a Chinese forum by GPT and might contain errors.

Original topic: dashboard 用户登录认证失败:authenticate failed

| username: 开心大河马

[TiDB Usage Environment] Test
[TiDB Version]
V7.1.0

[Reproduction Path] Operations performed that led to the issue
The original cluster was shut down, and a new cluster was added. The PD nodes of the new cluster do not overlap with the PD nodes of the original cluster, so the port remains 2379, while other components have their ports modified.
IP passthrough settings were also configured:
proxy-protocol.networks: 1xx.xxx.xxx.183,1xx.xxx.xxx.184

The cluster was installed on the control machine on the TiDB server node without PD nodes.

Cluster type:       tidb
Cluster name:       testdlstrack
Cluster version:    v7.1.0
Deploy user:        tidb
SSH type:           builtin
Dashboard URL:      http://1xx.xxx.xxx.183:2379/dashboard
Grafana URL:        http://1xx.xxx.xxx.181:3001
ID                    Role        Host            Ports        OS/Arch       Status  Data Dir                                Deploy Dir
--                    ----        ----            -----        -------       ------  --------                                ----------
1xx.xxx.xxx.181:3001   grafana     1xx.xxx.xxx.181  3001         linux/x86_64  Up      -                                       /opt/tidbdls/tidb-deploy/grafana-3001
1xx.xxx.xxx.182:2379   pd          1xx.xxx.xxx.182  2379/2380    linux/x86_64  Up|L    /opt/tidbdls/tidb-data/pd-2379          /opt/tidbdls/tidb-deploy/pd-2379
1xx.xxx.xxx.183:2379   pd          1xx.xxx.xxx.183  2379/2380    linux/x86_64  Up|UI   /opt/tidbdls/tidb-data/pd-2379          /opt/tidbdls/tidb-deploy/pd-2379
1xx.xxx.xxx.184:2379   pd          1xx.xxx.xxx.184  2379/2380    linux/x86_64  Up      /opt/tidbdls/tidb-data/pd-2379          /opt/tidbdls/tidb-deploy/pd-2379
1xx.xxx.xxx.181:9091   prometheus  1xx.xxx.xxx.181  9091/12021   linux/x86_64  Up      /opt/tidbdls/tidb-data/prometheus-9091  /opt/tidbdls/tidb-deploy/prometheus-9091
1xx.xxx.xxx.181:4001   tidb        1xx.xxx.xxx.181  4001/10081   linux/x86_64  Up      -                                       /opt/tidbdls/tidb-deploy/tidb-4001
1xx.xxx.xxx.182:4001   tidb        1xx.xxx.xxx.182  4001/10081   linux/x86_64  Up      -                                       /opt/tidbdls/tidb-deploy/tidb-4001
1xx.xxx.xxx.183:20160  tikv        1xx.xxx.xxx.183  20160/20180  linux/x86_64  Up      /opt/tidbdls/tidb-data/tikv-20160       /opt/tidbdls/tidb-deploy/tikv-20160
1xx.xxx.xxx.183:20161  tikv        1xx.xxx.xxx.183  20161/20181  linux/x86_64  Up      /opt/tidbdls/tidb-data/tikv-20161       /opt/tidbdls/tidb-deploy/tikv-20161
1xx.xxx.xxx.184:20160  tikv        1xx.xxx.xxx.184  20160/20180  linux/x86_64  Up      /opt/tidbdls/tidb-data/tikv-20160       /opt/tidbdls/tidb-deploy/tikv-20160
1xx.xxx.xxx.184:20161  tikv        1xx.xxx.xxx.184  20161/20181  linux/x86_64  Up      /opt/tidbdls/tidb-data/tikv-20161       /opt/tidbdls/tidb-deploy/tikv-20161

[Encountered Issue: Issue Phenomenon and Impact]
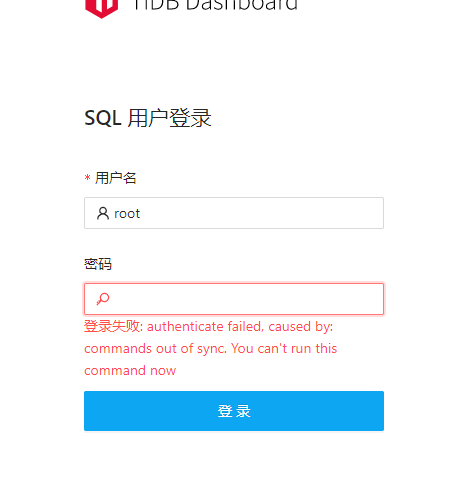
The root password has been modified and can log in, and a new dashboardAdmin user was added but still cannot log in, with the same error.
[Resource Configuration] Enter the TiDB Dashboard - Cluster Info - Hosts and take a screenshot of this page
Specific Error:
Login failed: authenticate failed, caused by: commands out of sync. You can’t run this command now

Specific Error Image:
image

| username: tidb菜鸟一只 | Original post link

Try restarting the corresponding PD node.

| username: 开心大河马 | Original post link

Let me give it a try.

| username: 开心大河马 | Original post link

Restarting doesn’t work either; it feels like there’s a synchronization issue somewhere. It seems to have this problem when passthrough is enabled, but you can log in to the dashboard when it’s disabled.

| username: 裤衩儿飞上天 | Original post link

Deploy HAProxy separately

| username: 像风一样的男子 | Original post link

Did you enable single sign-on?

| username: 开心大河马 | Original post link

What does standalone deployment mean? Does it not include all TiDB components?

| username: tidb菜鸟一只 | Original post link

If you enable HAProxy passthrough, you won’t be able to log in to TiDB through port 4000 on the HAProxy machine. Deploy HAProxy on a different machine…

| username: 开心大河马 | Original post link

I used HAProxy for load balancing and set up a VIP, restricting the use of the VIP to log in from 2 HAProxy hosts. What do you mean by single-node login?

| username: 开心大河马 | Original post link

However, I am not using the same port. Is that okay? Everything else is normal, only the dashboard reports an error.
Currently, the main node of HAProxy and the login node of the dashboard are on the same host. Does that matter?


| username: tidb菜鸟一只 | Original post link

This configuration will restrict the addresses 1xx.xxx.xxx.183 and 1xx.xxx.xxx.184 to only be able to log in to the TiDB server through the proxy protocol, and not through the normal protocol. You can manually log in to the TiDB server from these two machines to understand this.

| username: 开心大河马 | Original post link

Without VIP, indeed, you can’t log in.

So, can I switch the dashboard to a non-haproxy node? I saw on the official website that it is possible to switch nodes.

| username: 开心大河马 | Original post link

Supplementary specific process:
Analysis:

  1. The pass-through nodes are: installed with haproxy, restricting the use of 183/184 nodes to log in through vip.
    Pass-through is enabled, restricting 183, 184 to log in through vip.
    proxy-protocol.networks: 1xx.xxx.xxx.183,1xx.xxx.xxx.184

Attempting to log in directly to the tidb server shows that direct login is not allowed, and must log in through the vip set by haproxy.

[quote=“TiDB_silent, post:12, topic:1015386”]
image

  1. The dashboard node is on the pass-through 183 host,
    $ tiup cluster display testdlstrack --dashboard
    tiup is checking updates for component cluster …
    Starting component cluster: /home/tidb/.tiup/components/cluster/v1.12.2/tiup-cluster display testdlstrack --dashboard
    Dashboard URL: http://1xx.xxx.xxx.183:2379/dashboard/

Based on the suspicion of the previous tidb novice teacher, it may be because the pass-through restriction prevents direct connection, leading to login failure. Previously, when pass-through was not enabled, the dashboard had no issues. This suspicion is quite likely. Thanks for providing the specific direction.

  1. Although the official documentation states that the dashboard directly connects to the pd leader node, it is possible to switch the dashboard running node.
    部署 TiDB Dashboard | PingCAP 文档中心

Actual solution:
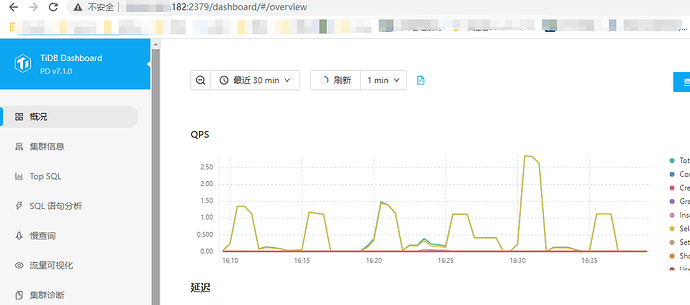
Conclusion: The pd nodes are at: 182, 183, 184. Switch the dashboard to the 182 node that is not restricted by pass-through, and log in again without any issues.
Steps:
Switch the dashboard node to the 182 non-pass-through restricted node:

Log in again without any issues:

| username: 随缘天空 | Original post link

Thank you for sharing. I have used HAProxy as a proxy before, but I haven’t encountered the situation you mentioned.

| username: system | Original post link

This topic was automatically closed 60 days after the last reply. New replies are no longer allowed.